Rooftop Solar EPCs: Why Code-Compliant Arrays Still Fail in Wind
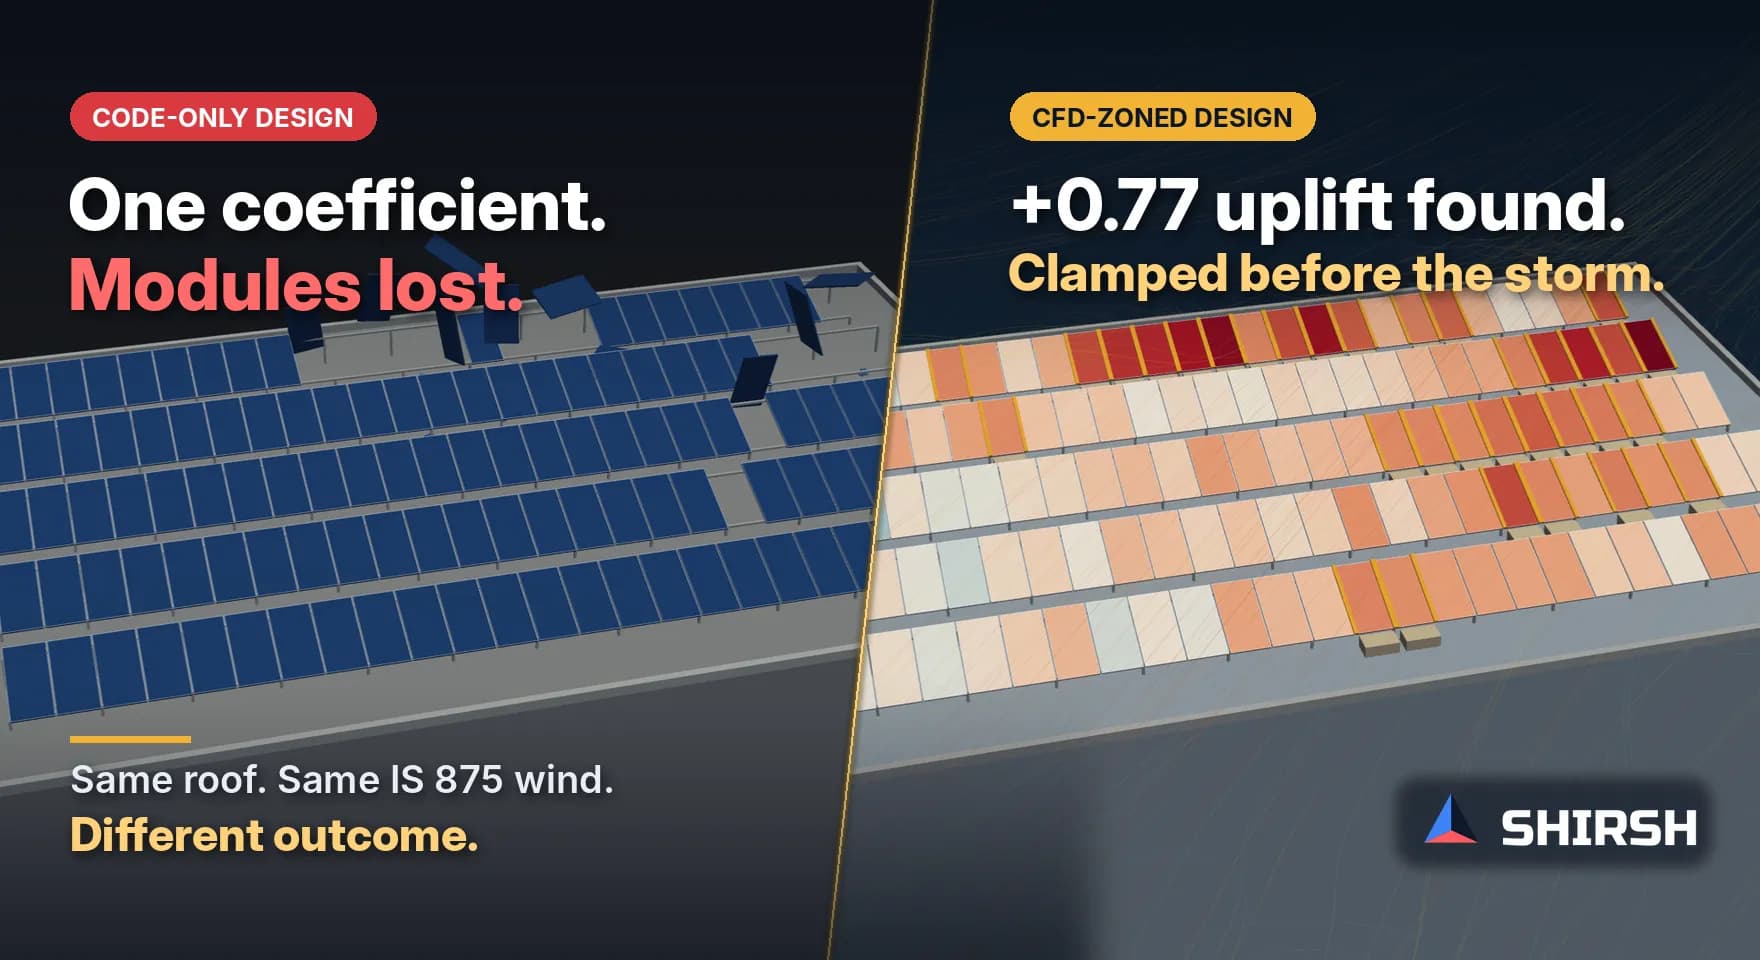
Rooftop arrays designed to IS 875 still lose modules in storms, and the EPC is the one called back to site. The code gives one coefficient for the whole array, but the wind does not load a roof that way. Six OpenFOAM cases show where the load really goes, and what an EPC should change before the clamps and anchors are bought.
Read the full article below for the methodology, the data, and the engineering decisions behind it.
Most rooftop solar structures in India are designed the same way. The basic wind speed for the city goes into IS 875 (Part 3): 2015, k1, k2 and k3 are applied, and a pressure coefficient is taken from one of the canopy tables. That one coefficient goes on every module, the same clamp spacing and the same anchors are repeated across the roof, and the drawings pass review because the arithmetic is right.
Then a storm comes through, modules leave the roof from one corner, and the EPC is the one called back to site. The design was code-compliant. The array still failed. This article is written for EPC teams who carry that risk. It explains why a code-based rooftop design can fail without any error in the calculation, what the wind actually does on a roof, and how a CFD study at the layout stage lets you put clamp, rail and anchor capacity where the load really is.
1. Code-compliant, and still on the ground
The best documented rooftop failures come from the 2017 Caribbean hurricanes. Rocky Mountain Institute's Solar Under Storm report listed clamps letting go, undersized or under-torqued bolts, racks not designed for the wind load and self-tapping screws used where through-bolts were needed. Its follow-up found top-down clips had failed in 96 percent of the systems RMI examined, and that once one module comes loose the ones beside it follow. FEMA's 2018 recovery advisory on rooftop panel attachment recorded roofs that lost every panel, and one figure in FEMA's Virgin Islands assessment shows a blow-off next to a roof edge that started at a failed rail connection.
India is seeing the same pattern. CSTEP's 2023 note on cyclones Fani, Tauktae and Biparjoy describes dislodged and broken panels, bent frames and weakened mounting structures, with entire arrays lost in some cases. After storms in mid-2025, Mercom reported rooftop systems that "could not survive even 120 kmph winds", and pointed to weak structures, inferior materials and rushed installation.
In these reports the failures start at a connection, usually near an edge, a corner or a row end, and then run along the row. None of the reports proves that a particular failure began under a corner vortex, and we will not claim that. What they do show is that a design which treats every module alike leaves its weakest connection exposed to its highest load.
2. Five places where a code-based rooftop design goes wrong
None of the following is a mistake in arithmetic. Each one is an assumption the usual method makes without saying so.
One coefficient for the whole array. IS 875 Part 3 has roof tables for the building (Tables 6 and 7) and net coefficients for free-standing canopies (Tables 8 and 9). It has no clause for solar panels mounted on a roof. Borrowing a canopy table treats a row of modules 300 mm above a roof as a free roof in open terrain, with no building under it, no separated flow over the roof edge and no corner vortices. The code itself says, in Clause 8.1, that interference effects can only be found from detailed wind tunnel or CFD studies.
Only two wind directions checked. Most calculations look at wind onto the front and onto the back of the panels. Wind tunnel work by Banks (2013) found that the most significant loads on roof-mounted solar consistently came for wind directions that form corner vortices, with the worst uplift between 0.8H and 1.2H from the roof edge, nearly twice as far into the roof as the usual edge zones.
Wind onto the panel faces taken as downforce. That is true for a free canopy. On a roof, the panels often sit in reversed flow behind the roof edge, and the air reaching them comes from behind. Our worked example below shows the windward row lifting when the wind blows straight onto the faces.
The parapet treated as protection. A parapet does shelter part of the array, but Banks found that common parapet heights raised peak loads by 20 to 30% compared with no parapet. ASCE 7-16 applies a parapet factor of up to 1.2 for this reason.
The same clamp and anchor everywhere. ASCE 7-16, Section 29.4.3, which is built on SEAOC PV2 wind tunnel work, multiplies the load by an array edge factor of 1.5 for exposed panels near row ends. An array designed with one layout throughout has no extra capacity in those zones, and that is where failures start.
3. What our CFD study showed
To show what these assumptions hide, we built a generic OpenFOAM model, not any particular project. The building is 20 m deep, 30 m wide and 15 m tall, with five rows of panels, each 26 m long, with a 2.0 m chord at 20° tilt, 0.3 m above the roof, a 3.5 m row pitch and a 2.0 m setback from the edge. Two cases add a 1.0 m parapet. The wind profile uses IS 875 terrain category 3 (z0 = 0.2 m, Clause 6.3.2.1). We solved six wind cases with simpleFoam and the k-omega SST model on about 380,000 cells, and report the mean net coefficient Cn, positive for uplift, on each row and on each 2 m length of row.

Figure 1. The worked example. At 0° and 45° the wind reaches the high, back edge of the rows first. At 180° and 225° it blows onto the panel faces.
Wind onto the back of the rows (cases A and B). The flow separates at the roof edge and every row sits in slow, reversed flow. Row 1 lifts slightly at +0.088, row 5 is pressed down at −0.232, and the array averages −0.079. A 1 m parapet changes little, with the average at −0.081. A single canopy value would be wrong for this array in both size and sign.

Figure 2. Case A, centre section. The purple line marks zero velocity along the wind, the edge of the reversed flow. All five rows are under it.
Cornering wind (cases C and D). Turn the wind 45° across the corner and the whole array goes into uplift, with an average of +0.236. Row 1 carries +0.371, 4.2 times its value at 0°. The highest 2 m length, +0.77, is in the middle of row 1, about 13 m from either end, at 3.3 times the array average. On the same roof, a length at the far end of row 3 is pressed down at −0.28. With the parapet, the average falls to +0.081, but row 1 still reaches +0.70 on one length, 4 to 6 m from its windward end. The hot spot moved; it did not go away.

Figure 3. Mean net coefficient on each 2 m length of each row. Rows R1 to R5 run left to right, and the position along the row runs bottom to top. This map is what an EPC needs to zone its clamps and anchors.
Wind onto the panel faces (cases E and F). At 180° the reversed flow over the roof strikes the undersides, and the windward row 5 lifts at +0.324 while row 1 is pressed down at −0.120. At 225°, across the corner onto the faces, one row runs from −0.72 at the windward corner to +0.52 about 10 m along. One row, one clamp design, two signs of load.

Figure 4. Case E, centre section, with the wind drawn left to right. The rows face the wind, yet the flow they meet comes from behind them.
Case | Wind | Row 1 | Row 5 | Array average | Range along the rows |
|---|---|---|---|---|---|
A | 0°, onto back of rows | +0.088 | −0.232 | −0.079 | −0.28 to +0.16 |
B | 0°, with 1 m parapet | +0.035 | −0.216 | −0.081 | −0.25 to +0.06 |
C | 45°, cornering | +0.371 | +0.184 | +0.236 | −0.28 to +0.77 |
D | 45°, with 1 m parapet | +0.238 | −0.007 | +0.081 | −0.45 to +0.70 |
E | 180°, onto panel faces | −0.120 | +0.324 | +0.092 | −0.20 to +0.40 |
F | 225°, cornering onto faces | −0.415 | +0.050 | −0.221 | −0.72 to +0.52 |
Mean net coefficient Cn = (p below − p above)/q at roof height, positive for uplift. Range is over 2 m lengths of row. OpenFOAM, steady RANS, k-omega SST.
Put these next to the five assumptions in section 2 and each one fails on this roof. The load changes sign from row to row, the worst direction is the corner, wind onto the faces lifts the windward row, the parapet moves the hot spot, and the highest load sits mid-row where a fixed end-zone rule would not add capacity.
4. How CFD helps an EPC prevent the failure
CFD does not replace the code calculation. It tells you how to apply it on your roof. Done at the layout stage, before the mounting structure is ordered, a rooftop wind study gives the EPC five things that a coefficient table cannot.
A load zone map of the actual roof. For each wind direction, the study shows which rows and which lengths of row carry uplift, which are pressed down, and where the peaks sit. The real roof goes into the model: plant rooms, water tanks, stair rooms, neighbouring buildings and the parapet as built, which on Indian rooftops often shape the flow as much as the building does.
Clamps, rails and fasteners zoned to the load. With the zone map, clamp type and spacing, rail splices and through-bolting can be specified heavily where the load is high and kept economical in the sheltered middle of the array, instead of one compromise layout everywhere.
Anchors and ballast placed where they are needed. Anchor spacing, chemical anchor capacity and ballast blocks can follow the uplift map. Ballast added uniformly is either wasted in the middle or short at the edges.
Layout options tested before anything is built. A larger setback from the edge, a lower tilt in the corner zones, a gap left where the corner vortex reattaches, or a decision on whether the parapet helps: each can be run as a case and compared on screen.
Loads that feed the structural check. Zone-wise pressures go straight into the FEA of the mounting structure and its connections, so the structural design and the wind study answer the same question.

Figure 5. Streamlines of the converged mean flow for the cornering wind case. The animation of all six cases illustrates the steady flow field; it is not a transient result.
5. What a CFD study can and cannot claim
We repeated case A on a finer mesh, 651,142 cells against 381,395. The array average moved from −0.079 to −0.078, and no row average changed by more than 0.035. Between iterations 1,750 and 2,000 no row average in any case moved by more than 0.011. The pattern and the signs are settled, and no conclusion here depends on the second decimal place.
A steady RANS model gives mean pressures. Design loads come from peaks, and Güemes, Fajardo and Raiola (Applied Sciences, 2021) found RANS predicts the first row of an array well while the downstream rows are "severely challenged". So the honest use of CFD on a rooftop is to find where the load goes and to compare layouts, and then to set peak design values in those zones with the code's edge and corner factors, a boundary-layer wind tunnel test to ASCE 49, or a validated LES on large or critical roofs. Our model also leaves out module frames, rails and the gaps between modules. A project study includes the real geometry.
6. When an EPC should ask for a rooftop wind study
Not every rooftop needs one. A study is worth commissioning, before procurement, when the building is tall or the roof is large, when the site is coastal or in a cyclone-prone zone, when the roof has parapets, plant rooms or steps, when the array is ballasted or anchored into a slab with limited capacity, and when the client is a commercial or industrial owner who will not accept a second installation.
On any rooftop project, it is worth asking your designer three questions. Which IS 875 table did the pressure come from, and why does that table apply to panels on a roof? Do the rows near edges, corners and row ends get stronger clamps and anchors than the middle, and if not, what justifies it? What is the connection capacity in the worst zone, not on average?
Where Shirsh fits
At Shirsh Technosolutions we carry out rooftop and ground-mounted solar wind studies for EPCs and developers, combining IS 875 and ASCE 7 checks with CFD in ANSYS Fluent and OpenFOAM, zone-wise load maps for clamps and anchors, and structural FEA of the mounting system in ANSYS Mechanical. If you have a rooftop project at layout stage, or an array that has already lost modules, please get in touch. Our earlier articles on how the IS 875 wind load goes wrong on a solar array and on single-axis trackers cover the ground-mounted side.
References: IS 875 (Part 3): 2015, Design Loads (Other than Earthquake) for Buildings and Structures, Part 3 Wind Loads, Bureau of Indian Standards (Clauses 6.3.2.1, 7.3.3.2, 7.3.3.3, 8.1). ASCE 7-16, Minimum Design Loads and Associated Criteria for Buildings and Other Structures, Section 29.4.3, as summarised in ICC, Significant Changes to the Minimum Design Load Provisions of ASCE 7-16. SEAOC PV2-2012 and PV2-2017, Wind Design for Solar Arrays. D. Banks, "The role of corner vortices in dictating peak wind loads on tilted flat solar panels mounted on large, flat roofs", JWEIA, 2013. G. A. Kopp and D. Banks, "Use of the wind tunnel test method for obtaining design wind loads on roof-mounted solar arrays", J. Struct. Eng. 139(2), 2013. A. Güemes, P. Fajardo and M. Raiola, "Experimental assessment of RANS models for wind load estimation over solar-panel arrays", Applied Sciences 11(6), 2496, 2021. Rocky Mountain Institute, Solar Under Storm, 2018, and Solar Under Storm Part II, 2020. FEMA, Recovery Advisory USVI-RA5, Rooftop Solar Panel Attachment, 2018. FEMA P-2021, Mitigation Assessment Team Report, Hurricanes Irma and Maria in the U.S. Virgin Islands, 2018. CSTEP, Impact of cyclones on India's solar rooftop PV systems, 2023. Mercom India, Monsoon winds expose weaknesses in rooftop solar systems, 9 June 2025. Worked example: OpenFOAM v1912 runs of cases A to F and the case A mesh check, computed for this article, 31 October 2026.
Click to view full size
Related case studies
Want to Apply This to Your Product?
Our engineers can help you implement these techniques on your specific components and assemblies.
Get insights like this in your inbox
Engineering deep-dives, simulation tips, and industry analysis. No spam, unsubscribe any time.