Project brief
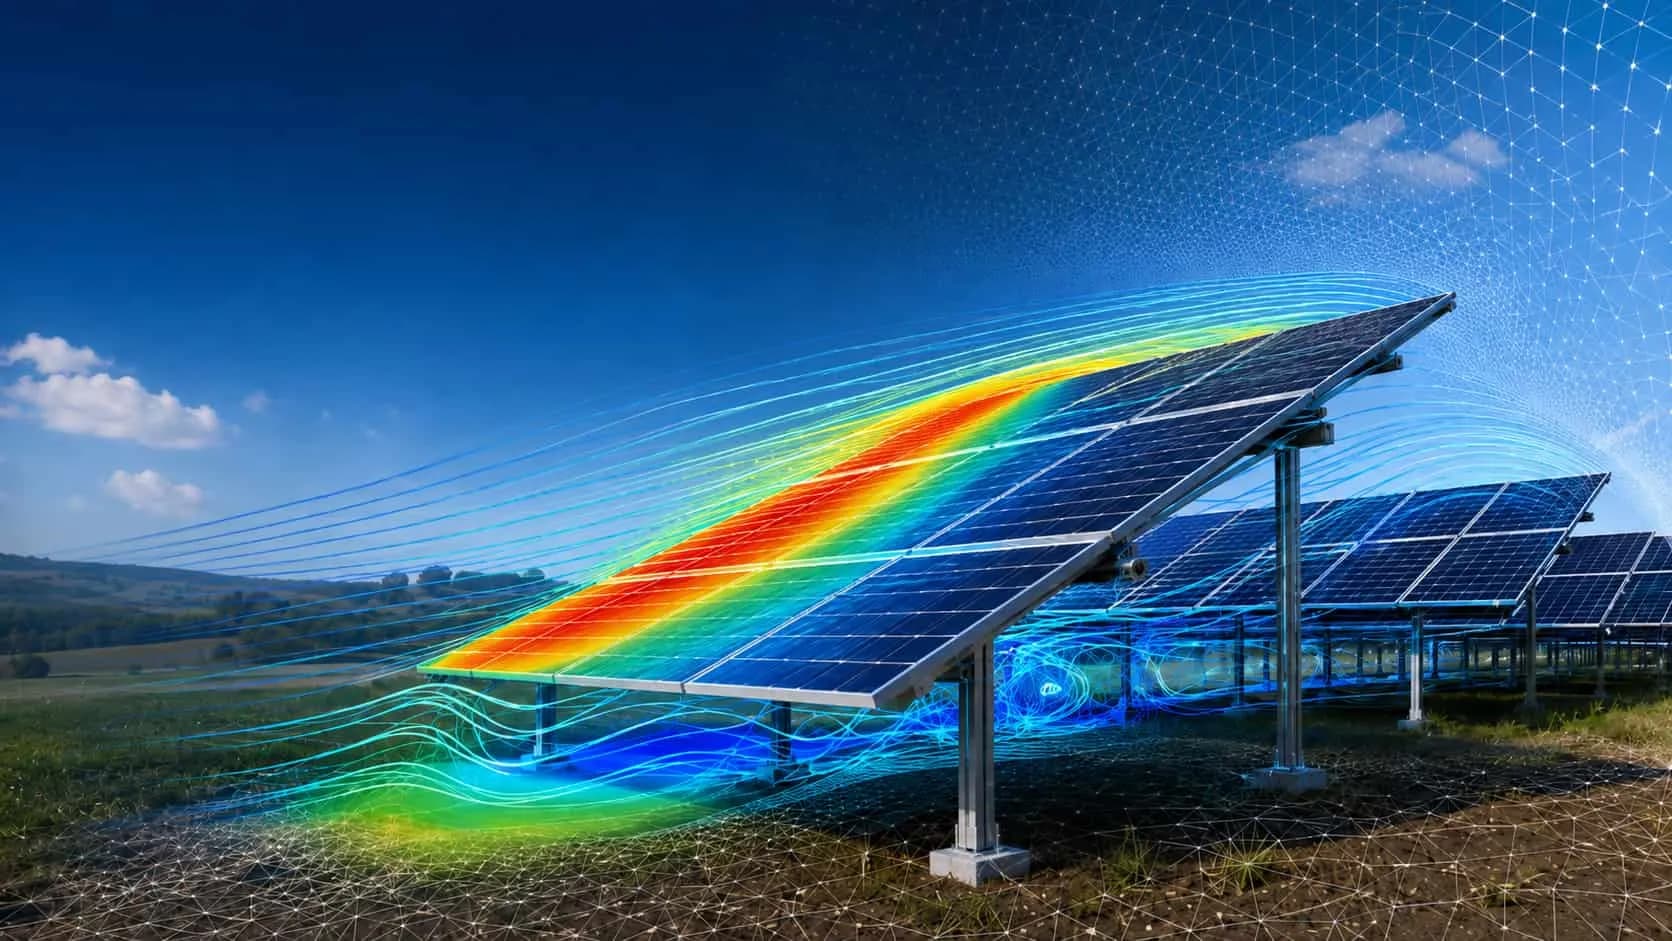
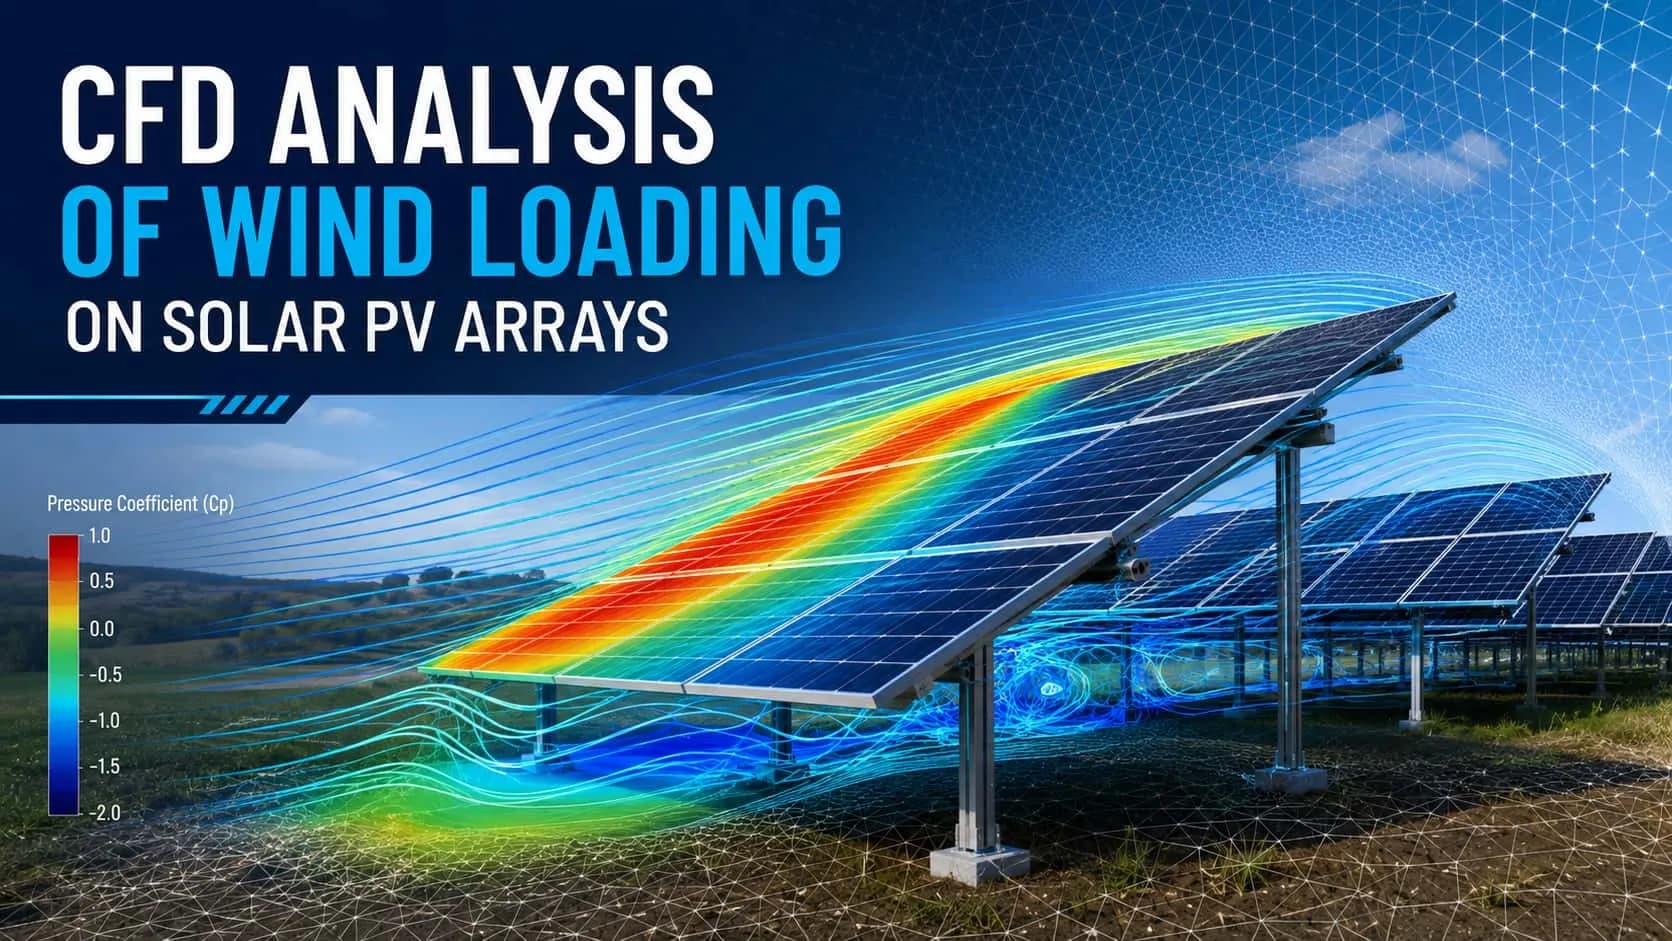
This CFD study analyzes the pressure distribution, velocity field, and area-weighted average pressure on solar photovoltaic (PV) panels under wind loading. The objective is to evaluate flow behavior and provide pressure coefficients for structural design optimization.
What was at risk
Wind loading is one of the primary design considerations for large-scale rooftop solar photovoltaic (PV) installations. The aerodynamic interaction between wind flow, building configuration, and PV array layout significantly influences pressure distribution and structural loading on the panels.
The client required a CFD study to:
Compare Separate Building and Common Building configurations.
Evaluate wind-induced pressure distribution for different PV array sizes.
Quantify pressure variation on the top and bottom surfaces of the PV panels.
Determine the critical wind loading condition for structural design.
Provide CFD-based pressure data to support structural optimization and design validation.
Solution offered
A comprehensive three-dimensional CFD analysis was performed using ANSYS Fluent to evaluate airflow behavior and wind-induced pressure distribution on rooftop solar PV arrays under different building configurations and spacing conditions.
The numerical study included:
Separate Building and Common Building configurations.
Case matrix based on PV array location.
2L×3, 4L×3, and 6L×3 PV array layouts.
Velocity distribution analysis.
Pressure distribution analysis.
Area-weighted average pressure extraction on the top and bottom panel surfaces.
The CFD results were compared across all cases to identify the critical wind loading condition and provide pressure data for structural design optimization and validation.
Challenges we overcame
Comparing pressure and velocity fields across building configurations and spacing conditions.
Predicting pressure distribution on the top and bottom surfaces of the PV panels.
Analyzing flow separation and recirculation zones around the PV panels and support structures.
Identifying the critical wind loading case for structural design.
How we executed
- 1
Geometry Preparation- Developed three-dimensional CAD models representing Separate Building and Common Building configurations with multiple PV array layouts.
- 2
Mesh Generation- Generated a high-quality computational mesh with local refinement around the PV panels and support structures to accurately resolve the airflow.
- 3
Boundary conditions- Applied a Power Law wind velocity profile at the inlet with pressure outlet and no-slip wall boundary conditions for all CFD cases.
- 4
CFD Solver Setup- Configured a steady-state, pressure-based solver using the SST k-ω turbulence model to predict velocity and pressure distributions under wind loading.
- 5
Post-Processing- Extracted velocity contours, pressure contours, streamlines, and area-weighted average pressure on the top and bottom panel surfaces to evaluate aerodynamic loading across all cases.
Project outcome
Reduced design time by replacing multiple physical wind tunnel iterations with CFD simulations.
Minimized development cost through virtual aerodynamic performance evaluation.
Accelerated design optimization using pressure and velocity analysis.
Provided reliable engineering data for faster structural design decisions with reduced project cost.
Project gallery
Where this lives
Software used
Related solutions
Industries
Related insights
Why Single-Axis Solar Trackers Need FEA, CFD, and Aeroelastic Analysis — Not Just IS 875
A single-axis solar tracker can clear every line of IS 875, pass its STAAD model, and still fail in a windstorm that never reached the code design speed. The reason is uncomfortable but simple: the code hands you a static pressure, and the structure that tore apart was responding to a dynamic, fluid-structure problem the code was never written to see. This is sharpest with single-axis trackers, which behave less like a stiff steel frame and more like a bridge deck on a torsional spring. Here is where IS 875 stops, where FEA and CFD pick up, and why "passes the code" and "survives the wind" are two different questions.
ReadWhy Fixed-Tilt Ground-Mount Solar Structures Fail
Fixed-tilt ground-mount is the structure everyone treats as solved. No moving parts, a straight load path from module to rail to post to ground, a static wind check, done. That reputation for simplicity is precisely why these structures fail — not from exotic physics, but from foundations pulled out of the soil, connections detailed for the wrong load direction, slender members that buckled under uplift, and corners that saw far more wind than a borrowed coefficient ever admitted. Walk the load path with a failed array in front of you and the causes are rarely mysterious. Here is how to read the damage, and the analysis chain that would have caught it on paper.
ReadHow to Check a Cold-Formed Solar Mounting Structure to IS 801: A Step-by-Step Guide
Most ground-mounted solar structures in India are made from cold-formed steel — thin steel sheet bent into channels and hat sections. Engineers find the wind load from IS 875 Part 3, then check the steel using IS 801. Two mistakes are very common. First, engineers use the full cross-section, but thin steel does not work that way — part of it buckles early, so the code makes you use only the "effective" part. Second, engineers check only the steady (static) load and skip the moving (dynamic) effects. This guide explains both problems in simple steps. It then checks the four main members of a solar structure — post, rafter, bracing, and a 1 mm hat purlin — with full numbers, so you can see exactly where the common shortcuts go wrong.
ReadFour Quiet Ways the IS 875 Wind Load Goes Wrong on a Solar Array
The wind-load calculation almost never fails an audit. It fails the structure. IS 875 (Part 3) is a sound loading code, and the arithmetic in most reports is right. What moves the answer is a handful of small choices in how the code gets applied, and on a light tilted array those small moves decide which members are under-built. Here is the chain done properly, and the four places it usually slips.
ReadAt a glance
We apply the same rigour to every engagement
Let us show you what's possible for your product.