Hot-Aisle Containment: What CFD Shows That Rack Inlet Sensors Miss
A rack inlet sensor at mid-height can read 20 °C on every rack while 28.7 percent of the inlet area is above the 27 °C recommended limit. A small OpenFOAM study of one rack row, with and without hot-aisle containment, shows where the hot air gets in and why containment only helps once the airflow matches the racks.
Read the full article below for the methodology, the data, and the engineering decisions behind it.
Most data halls report rack inlet temperature from one sensor per rack, often clipped to the front door somewhere near the middle. If that sensor reads 20 °C across the row, the room looks healthy and the containment looks like it is doing its job.
The trouble is that a rack does not breathe at one point. It draws air over its whole front face, two metres tall, and the hot air that finds its way back to the inlet usually arrives at the top, at the row ends, or through gaps nobody has looked at since the last move. This article uses a small CFD study of one rack row to show where that air goes, what a mid-height sensor reports while it happens, and what hot-aisle containment does and does not fix.
1. What the guidelines ask for
The ASHRAE TC 9.9 thermal guidelines set the recommended inlet range for IT equipment at 18 to 27 °C, with a wider allowable range of 15 to 32 °C for class A1 equipment. The limits apply at the server inlet, which in a rack means the whole front face. ASHRAE also suggests monitoring rack inlets at the bottom, middle and top of the rack, precisely because the temperature is rarely uniform with height.
Two simple indices help to judge a whole row. The Rack Cooling Index for the high side, RCI(HI), was proposed by Herrlin. It adds up how far each inlet is above the maximum recommended temperature, divides by how far it could be before reaching the maximum allowable, and expresses the result as a percentage. With 27 °C and 32 °C as the two limits, 100 percent means no inlet is above 27 °C, and lower values mean more inlet area, or hotter inlet area, is over the line.
The Return Temperature Index, RTI, compares the temperature rise of the cooling air with the temperature rise across the IT equipment. Above 100 percent means hot exhaust is being drawn back into the inlets (recirculation). Below 100 percent means cold supply air is going straight back to the cooling units without passing through any server (bypass). If every bit of air leaves through the return, RTI is fixed by the airflow ratio alone: supply 80 percent of what the racks draw and RTI is 125 percent. You can work that out on a calculator. What the calculator cannot tell you is which inlets take the recirculated air.
2. The worked example
We modelled one row of five racks in a hot aisle / cold aisle pod. Each rack is 0.6 m wide, 1.2 m deep and 2.0 m tall, and carries 6 kW with a 12 K air temperature rise. With air at 1.2 kg/m³ and a specific heat of 1006 J/kg K, that needs 0.4141 m³/s per rack, or 2.07 m³/s for the row.
To keep the model small, only half of the pod was solved: the domain runs from the centre of the hot aisle to the centre of the cold aisle, with symmetry planes on both centrelines. The hot aisle is 1.2 m wide and the cold aisle 1.2 m wide. The ceiling is at 3.0 m and there is 1.2 m of open floor beyond each end of the row. Cold air at 20 °C enters through perforated tiles in the cold aisle, and warm air leaves through a return grille in the ceiling over the hot aisle.
One detail was added on purpose. Rack R3, in the middle of the row, has an open 0.2 m slot through its full depth between 1.6 m and 1.8 m above the floor. This stands in for missing blanking panels, which is one of the most common leakage paths in a working data hall. The slot is present in every case.

The model. Left: plan of the half pod with racks R1 to R5, the perforated tiles and the hot aisle. Right: section through rack R3 with the open slot and the three sensor heights used in this article. The red lines show the containment used in cases C, D and E.
Five cases were run.
Case A: open aisles, tile supply equal to the rack airflow (100 percent).
Case B: open aisles, tile supply at 80 percent of the rack airflow.
Case C: hot aisle contained, supply at 80 percent.
Case D: hot aisle contained, supply at 100 percent.
Case E: hot aisle contained, supply at 105 percent.
In the contained cases the hot aisle is closed by doors at both row ends and by a panel from the rack tops to the ceiling. The doors stop 0.1 m short of the floor, which represents the undercut and gaps that real containment doors have.
The flow was solved in OpenFOAM as steady, buoyant, turbulent flow with the k-omega SST model and the Boussinesq approximation for buoyancy. Each rack is a black box: air leaves the cold aisle through the rack front at a fixed flow rate and comes out of the rack rear at the same flow rate, 12 K hotter than the average temperature that went in. The rack exhaust temperature was updated every 100 iterations. The main mesh used 10 cm cells, 31,824 in all. The steady solver did not settle to a single answer, because buoyant plumes in a room wander, so every value in this article is an average of 21 snapshots taken between iterations 2,000 and 4,000.
3. The sensor at 1 m reads 20 °C almost everywhere
The table gives the row results. Each rack face is split into 10 cm cells, and each cell counts as one inlet for RCI(HI) and for the share of inlet area above 27 °C.
Case | Sensor at 1.0 m (°C) | Face average (°C) | Top sensor at 1.85 m (°C) | Highest inlet (°C) | Inlet area above 27 °C (%) | RCI(HI) (%) |
|---|---|---|---|---|---|---|
A, open, 100% | 20.0 | 20.5 to 21.6 | 24.0 to 29.2 | 31.9 | 7.3 | 96.5 |
B, open, 80% | 20.0 | 21.3 to 24.1 | 28.8 to 32.1 | 32.5 | 28.7 | 80.2 |
C, contained, 80% | 20.0 to 27.4 | 22.6 to 25.4 | 30.2 to 32.1 | 34.1 | 31.0 | 79.7 |
D, contained, 100% | 20.0 to 21.2 | 20.0 to 20.8 | 20.0 to 21.1 | 22.6 | 0.0 | 100.0 |
E, contained, 105% | 20.0 | 20.0 | 20.0 | 20.0 | 0.0 | 100.0 |
The sensor columns give the lowest and highest reading across the five racks. Look at case B first. Every one of the five mid-height sensors reads 20.0 °C, the supply temperature. A building management screen showing those five numbers would raise no alarm. Yet 28.7 percent of the inlet area is above 27 °C, the hottest inlet is at 32.5 °C, just over the 32 °C allowable limit, and RCI(HI) is 80.2 percent.

Inlet temperature over the front faces of racks R1 to R5, seen from the cold aisle. The circle is a sensor at 1.0 m and the triangle a sensor at 1.85 m. In cases A and B the hot band sits in the top half metre, well above the circle.
The face averages do not help much either. In case B they range from 21.3 to 24.1 °C, all comfortably inside the recommended range, because the cool lower part of each face pulls the average down. The heat is concentrated in the top band, and a server mounted in the top few units of these racks would see air close to 32 °C.
Even case A, with the tiles delivering exactly what the racks need, is not clean. The highest inlet, 31.9 °C, sits in the top 10 cm of the two end racks, at their outer corners, where hot air comes round the end of the row and over the rack tops. With open aisles, matching the airflow on paper still leaves the top corners of the row exposed.
4. The sensor that does see it
The top sensor, at 1.85 m, tells a different story. In case B it reads between 28.8 and 32.1 °C, which puts every rack over the recommended limit at the top. This is the simplest practical lesson in the study: a sensor near the top of the rack is worth more than one at mid-height, and the three-point arrangement ASHRAE suggests would have caught case B immediately.

For each rack: the sensor at 1.0 m, the face average, the top sensor and the hottest point on the face. The dashed line is 27 °C.
A top sensor is still a point. In case A the top sensors read between 24.0 and 29.2 °C, while the face maxima reach 31.9 °C at the end racks. The peak values also moved between snapshots: on rack R2 in case A the hottest point wandered between 25.5 and 31.0 °C over the averaging window. Real rooms do the same. A single reading taken during a walk-round can catch the peak or miss it.
5. Containment does not cure an airflow shortfall
Case C is the one most owners would expect to be fine. It has the same 80 percent supply as case B, with the hot aisle fully contained. RCI(HI) came out at 79.7 percent, slightly worse than the open-aisle case, and the hottest inlet rose to 34.1 °C, above the 32 °C allowable limit.
The reason is mass balance. The racks still draw 2.07 m³/s and the tiles supply 1.66 m³/s, so 0.41 m³/s has to come from somewhere. With the hot aisle closed off, it comes through the leaks. The model shows 0.199 m³/s of hot air at 36.8 °C pushed back through the open slot in rack R3 into the cold aisle, and 0.193 m³/s escaping under the two containment doors at the row ends. Together that is 0.392 m³/s, close to the shortfall, which is a useful check on the model.

Air temperature with in-plane velocity arrows on vertical sections through rack R3 (top row) and through the end rack R1 (bottom row). The hot aisle is on the left, the cold aisle on the right. The black line marks 27 °C. In case C hot air comes back through the slot in R3; in cases D and E the same slot carries cold air the other way.
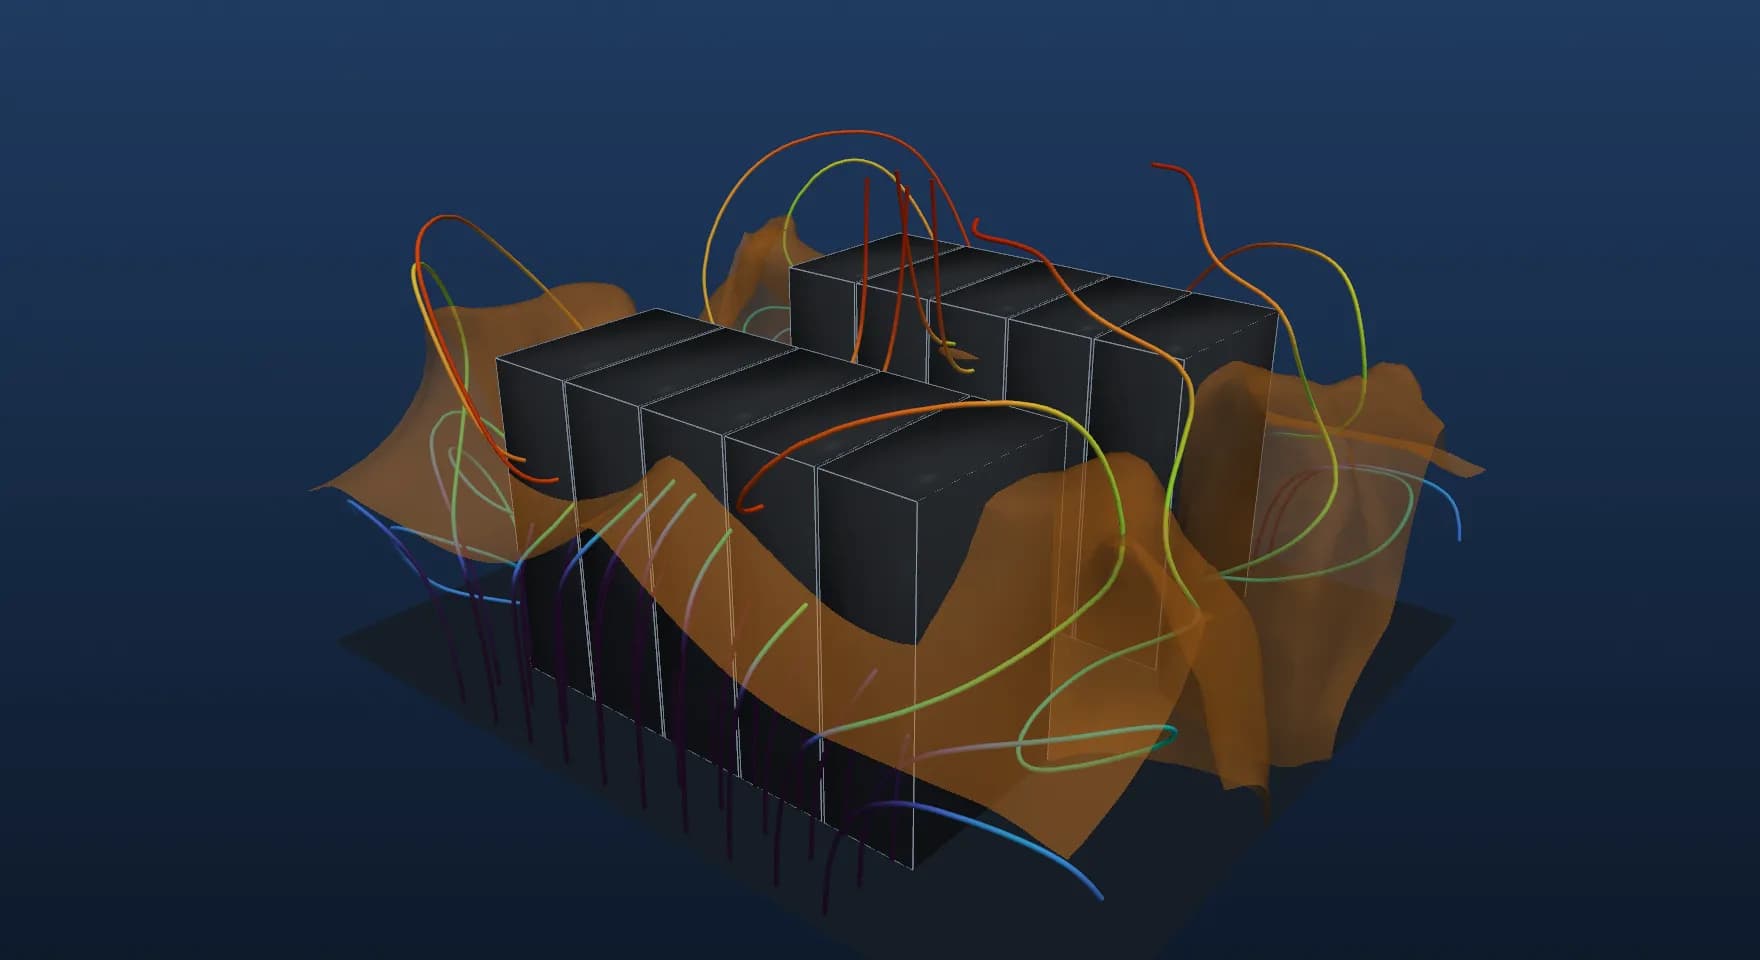
3D streamline animation of all five cases, A to E. Particles follow streamlines of the averaged flow and are coloured by air temperature. Watch the hot air loop over the rack tops in cases A and B, leak back through the open slot in case C, and the cold air bypass into the hot aisle in case E. The animation illustrates the averaged flow field; it is not a transient result.
Here the mid-height sensor on rack R3 does read high, at 27.4 °C, because the leak sits just above it and the hot jet spreads down the face. The hottest point, 34.1 °C, is on rack R3 at 1.55 m, just under the slot. On the other four racks the mid-height sensors read between 20.0 and 20.4 °C, while their top sensors read over 30 °C. Hot air leaking out under the doors rises along the row ends and is drawn over the rack tops from the cold-aisle side.
Containment changes the path the hot air takes. It does not change how much air the racks need.
6. Balance first, then decide how much margin to carry
Case D keeps the containment and the leaks and raises the supply to 100 percent. Every inlet in the row is now below 27 °C and RCI(HI) is 100.0 percent. The hottest inlet, 22.6 °C, is on the end racks R1 and R5, where some warm air escapes under the doors (0.061 m³/s in total) while 0.070 m³/s of cold air goes the other way through the slot in R3. The flows through the leaks nearly cancel, but they are not zero, and the end racks feel the difference.
Case E adds 5 percent more supply. All inlets are at 20.0 °C, and both leak paths now carry cold air into the hot aisle, 0.098 m³/s through the slot and 0.012 m³/s under the doors. That is bypass. RTI falls to 95.2 percent and the return air temperature drops from 32.0 to 31.4 °C, which costs cooling capacity and efficiency at the cooling units.
The comparison of cases A and D is the fair test of containment, since both have 100 percent supply. Containment moved RCI(HI) from 96.5 to 100.0 percent and brought the hottest inlet down from 31.9 to 22.6 °C. That is a real gain. It only appeared once the airflow was matched, and the leaks still decided which racks were warmest.
7. How far to trust the numbers
Two checks were run. Case B was repeated on a finer mesh with cells of about 6.7 cm, 107,406 cells in all. RCI(HI) moved from 80.2 to 82.5 percent, the inlet area above 27 °C from 28.7 to 25.2 percent and the hottest inlet from 32.5 to 33.3 °C. The mid-height sensors read 20.0 °C on both meshes, and the top sensors read 28.8 to 32.1 °C on the main mesh and 29.7 to 31.9 °C on the fine one. The conclusions do not depend on the mesh, but individual peak values moved by up to 0.8 °C, so they should be read with that in mind.
The second check is the heat balance. For each case the return air temperature follows from the rack heat load and the supply flow. The model returns 31.8 °C against 32.0 °C for case A, 33.6 against 35.0 °C for case B, 35.7 against 35.0 °C for case C, 31.9 against 32.0 °C for case D and 31.4 against 31.43 °C for case E. Case B is the weakest, which fits with it being the least steady flow.
The model is a teaching example. The racks are uniform black boxes with constant fan flow, the tiles deliver perfectly even flow, and the room has no cooling units, cable trays or lighting. A design study would use the real rack layout and loads, the measured tile flows or a model of the floor void, the cooling unit positions and controls, and the real gaps in the containment.
8. A reviewer's checklist
When we review a containment or airflow study for a data hall, these are the questions we ask.
What you see in the report | Why it matters | What to ask for |
|---|---|---|
One inlet sensor per rack at mid-height | Recirculation arrives at the top and at row ends | Bottom, middle and top sensors, or at least a top sensor on end racks |
Average inlet temperature per rack | The cool lower face hides a hot top band | Maximum inlet per rack and the share of inlet area above 27 °C |
Containment shown as a perfect seal | Leaks decide where recirculation and bypass happen | Door gaps, missing blanking panels and cable openings in the model |
Total cooling capacity checked, airflow not | Containment cannot make up an airflow shortfall | Supply flow against rack flow, per pod, and RTI |
One converged picture | Buoyant flow in a room wanders | Time-averaged results and a statement of how much the peaks move |
No mesh or heat balance check | Peak inlet values are sensitive to both | A second mesh and the return temperature against the heat load |
Where Shirsh fits
In this small study a row could show 20 °C on every mid-height sensor while 28.7 percent of its inlet area was above the recommended limit, and containment only paid off once the airflow matched the racks.
Shirsh TechnoSolutions carries out CFD studies of data halls, server rooms and containment layouts, from airflow balance and tile layout to leakage, sensor placement and cooling unit failure cases. If you have a containment retrofit to plan, a hot spot to explain or an airflow report to review, please get in touch.
Click to view full size
Related case studies


Want to Apply This to Your Product?
Our engineers can help you implement these techniques on your specific components and assemblies.
Get insights like this in your inbox
Engineering deep-dives, simulation tips, and industry analysis. No spam, unsubscribe any time.