
BESS Container HVAC: Why One Rack Runs Hot and What CFD Shows
A BESS container HVAC unit controls on its return air, and that reading can stay the same while the racks inside breathe very different air. We ran four OpenFOAM cases on a generic ten-rack container to show which rack ran hottest, why 30% more airflow barely changed the pattern, and how swapping the supply and return closed most of the gap.
Read the full article below for the methodology, the data, and the engineering decisions behind it.
Most BESS container HVAC units control on their return air temperature. If that reading sits where it should, it is natural to assume the racks are fine. The return grille sees a mix of air from the whole container, though, and the mix can stay the same while one rack breathes noticeably warmer air than the others.
This article works through a small OpenFOAM study of a generic ten-rack container. It shows which rack ran hottest and why, what happened when the airflow was raised by 30%, why ceiling diffusers improved the spread while making every rack warmer, and how swapping the supply and return positions closed most of the gap with the same unit and the same air.
1. Why one rack matters
In a battery rack the cells are connected in series, and the battery management system stops charge or discharge when the first cell reaches its limit. The weakest cell therefore sets the usable energy of the whole string. Cell ageing depends on temperature, and post-mortem studies such as Waldmann and co-authors (2014) show that the ageing mechanisms themselves change with the temperature at which cells are cycled. A rack that runs a couple of degrees warmer every day does not fail on its own. It drifts away from the others, and over the years it becomes the rack that limits the system.
So the useful question for a container is which rack breathes the warmest air, and by how much. The average temperature answers a different question.
2. The worked example
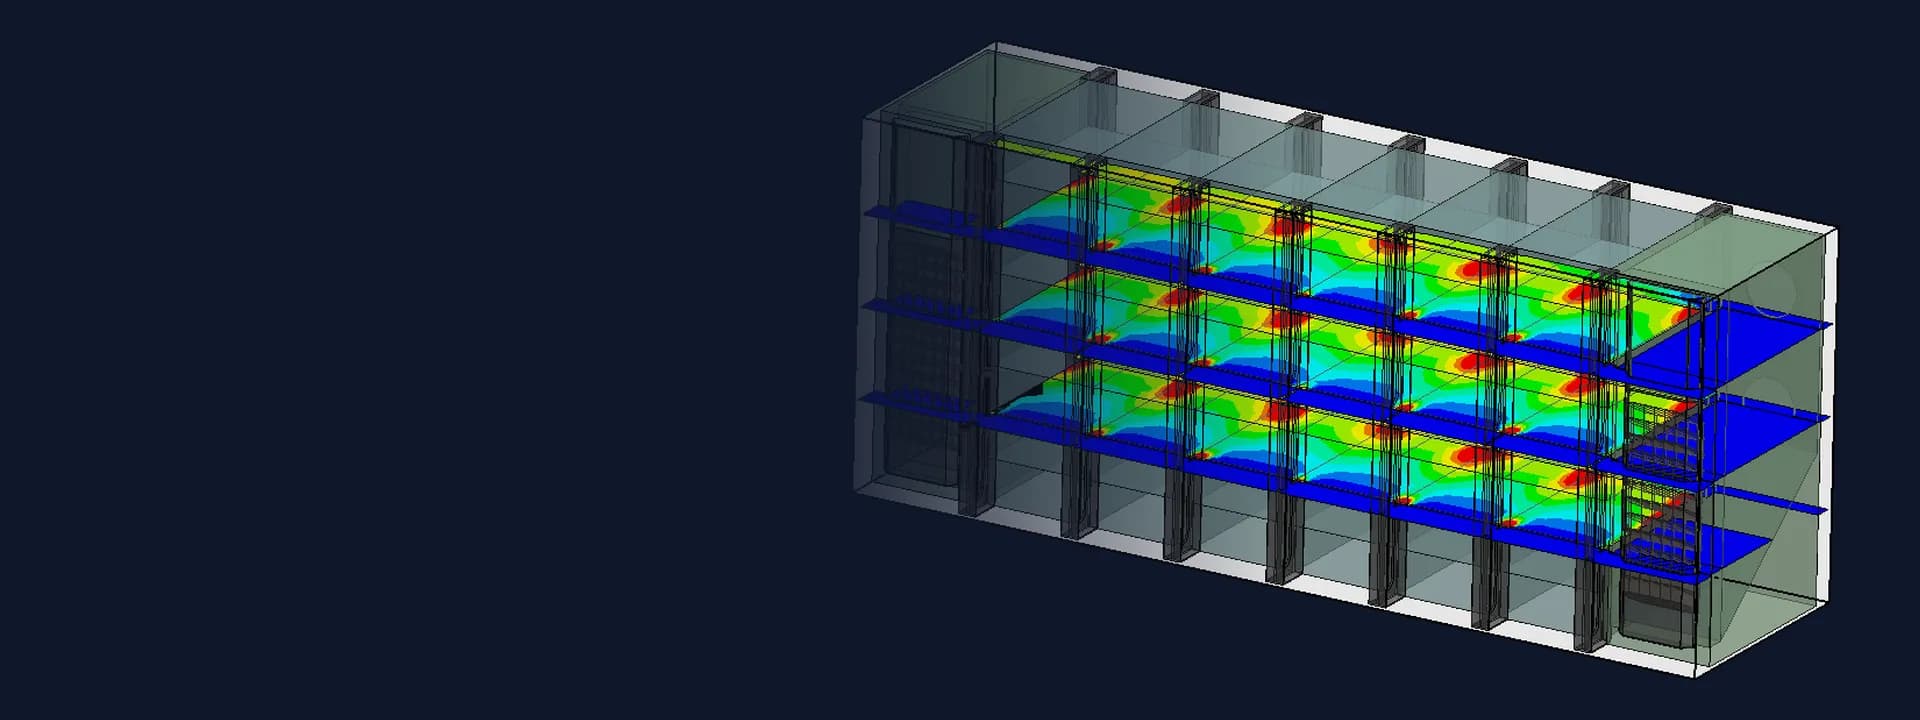
The model is a generic container interior, not any particular product: 6.0 m long, 2.4 m wide and 2.4 m high. Ten racks stand in two rows of five, 0.8 m wide, 0.6 m deep and 2.0 m tall, with a 0.8 m aisle between the rows and a 0.2 m gap behind each row. Each rack dissipates 2.0 kW, 20 kW in all, and its fans move 0.24 m³/s from the aisle face to the back. At that flow the air warms by 6.9 K through the rack. The HVAC unit sits on one end wall and supplies air at 20 °C.
We solved steady, buoyant flow with OpenFOAM (buoyantBoussinesqSimpleFoam, k-epsilon, wall functions) on a 0.1 m hexahedral mesh of 34,560 cells. Each rack is a porous zone that only lets air pass front to back, with a momentum source holding its fan flow and a volumetric heat source of 2.0 kW. Container walls are adiabatic. The rack inlet temperature reported below is the mean air temperature in the 0.2 m layer of aisle in front of each rack face, over the full rack height.

Figure 1. Worked example. R1 and R6 stand next to the HVAC unit, R5 and R10 at the far end. The end-wall grilles span the aisle width; case C replaces the end-wall supply with five ceiling diffusers over the aisle.
Four cases were run:
Case A: supply grille high on the end wall (0.4 m tall, at the ceiling), return grille low (0.2 to 0.8 m above the floor), 2.0 m³/s.
Case B: the same layout with the airflow raised to 2.6 m³/s.
Case C: 2.0 m³/s through five 0.4 x 0.4 m ceiling diffusers above the aisle, return low on the end wall.
Case D: the end-wall grilles swapped, supply low and return high, 2.0 m³/s.
Note that the racks together move 2.4 m³/s. With a 2.0 m³/s supply, at least 0.4 m³/s of the air entering the racks has already passed through a rack once. Where that recirculated air ends up is what decides the hot rack.
3. Results at a glance
Case | Layout | Supply (m³/s) | Hottest rack inlet (°C) | Coolest rack inlet (°C) | Spread (K) | Average of 10 rack inlets (°C) | Return grille (°C) |
|---|---|---|---|---|---|---|---|
A | End wall, supply high, return low | 2.0 | 26.34 (R1, R6) | 23.37 (R5, R10) | 2.97 | 24.63 | 28.38 |
B | As A | 2.6 | 25.08 (R1, R6) | 22.65 (R10) | 2.43 | 23.73 | 26.41 |
C | Ceiling diffusers, return low | 2.0 | 27.77 (R1) | 25.73 (R5) | 2.03 | 27.02 | 28.42 |
D | End wall, supply low, return high | 2.0 | 24.78 (R1, R6) | 24.04 (R5, R10) | 0.74 | 24.28 | 28.35 |
Table 1. Rack inlet temperatures from the OpenFOAM runs. Spreads are worked out before rounding. The two rows mirror each other within 0.12 K in every case.
4. Case A: the hot rack is the one next to the unit
With the supply high and the return low on the same wall, the cold jet runs along the ceiling to the far end of the container, drops, and comes back along the aisle towards the return grille. On its way back it collects the warm air leaving the racks through the gaps and over the rack tops. By the time it passes R1 and R6, right beside the unit, it is the warmest air in the aisle.
R1 and R6 drew air at 26.34 °C. R5 and R10 at the far end drew 23.37 °C, so the spread across the ten racks was 2.97 K. The local peak in the R1 inlet layer was 28.54 °C, at about 0.95 m above the floor, which is where the warm return stream passes the rack face on its way down to the grille.

Figure 2. Air temperature in the vertical plane just in front of the row 1 rack faces (0.8 to 0.9 m from the wall). Dashed outlines mark the racks. In case A the warm return stream sweeps past R1 and R2 at mid height. In case D the cool supply runs along the lower part of the aisle and the warm air rises to the return at the top.
The rack closest to the cooling unit is usually assumed to be the best served. Here it is the worst, because it sits on the return path.
5. Case B: more air lowers everything, not the gap
Raising the supply by 30% to 2.6 m³/s is the usual first response to a hot rack. It did lower every rack inlet, by 0.71 K at R5 to 1.26 K at R1, and the return fell from 28.38 °C to 26.41 °C. The hottest rack inlet came down from 26.34 °C to 25.08 °C.
The spread only fell from 2.97 K to 2.43 K, and the same two racks stayed hottest. The flow pattern did not change. A stronger jet still reached the far end first and still came back past R1 and R6 carrying the warmest air. More airflow treated the symptom and left the pattern in place.
6. Case C: a better spread that hides a warmer container
Case C kept 2.0 m³/s but delivered it through five ceiling diffusers along the aisle, one above each pair of racks. On the spread alone this looks like an improvement: 2.03 K against 2.97 K in case A.
The average rack inlet, though, went up from 24.63 °C to 27.02 °C, and the hottest rack inlet rose to 27.77 °C. The downward jets appear to pull in the warm air that collects under the ceiling above the racks before they reach the aisle floor, so the racks breathe a well-mixed but warmer aisle. The peak in the R1 inlet layer was 32.62 °C at about 1.95 m, at the top of the rack face, where exhaust spilling over the rack tops meets the diffuser jets.
A uniformity number on its own can therefore mislead. A study report should give the hottest rack inlet and the average next to the spread, and the location of the peak.
7. Case D: same unit, same air, grilles swapped
Case D used the same 2.0 m³/s and the same end-wall grilles, with the supply moved low and the return moved high. Cool air now runs along the lower part of the aisle, where every rack draws it in, and the warm air leaving the racks rises to the ceiling and back to the return at the top of the end wall.
The spread fell to 0.74 K. The hottest rack inlet dropped to 24.78 °C, 1.56 K below case A, and the average of the ten inlets was 24.28 °C. R1 and R6 were still the warmest, but only just. There is a trade-off to note: with a low supply, the air at the face of each rack is cooler at the bottom than at the top. The peak in the R1 inlet layer was 27.79 °C at about 1.95 m, so modules at the top of a rack see warmer air than those at the bottom.

Figure 3. Mean rack inlet temperature for the five racks of row 1 in each case. Case A slopes down from the unit to the far end; case B is the same slope moved down; case C is flatter but higher; case D is nearly flat.

Figure 4. Streamlines of the converged flow in case A, coloured by air temperature from 20 to 32 °C. The supply jet (blue) runs along the ceiling to the far end; the returning air warms as it passes the racks and is warmest beside the unit. Frame from the 3D streamline animation of all four cases.
8. What the return sensor sees
The return grille read 28.38 °C in case A, 28.42 °C in case C and 28.35 °C in case D. Those three readings are within 0.07 K of each other, while the hottest rack inlet ranged from 24.78 °C to 27.77 °C and the spread from 0.74 K to 2.97 K.
This follows from the energy balance. With 20 kW going into 2.0 m³/s of air at 20 °C, the return has to settle near 28.28 °C whatever the layout; the CFD gave 28.38 °C in case A, 0.10 K above it. For case B the balance gives 26.37 °C and the CFD gave 26.41 °C. The return temperature tells you the container is rejecting its heat. It cannot tell you where that heat went on the way.
9. Mesh check and limits
Case A was re-run on a 0.067 m mesh of 116,640 cells, started from the coarse solution. The spread moved from 2.97 K to 2.85 K. R1 went from 26.34 °C to 26.38 °C, R5 from 23.37 °C to 23.52 °C, and the return stayed at 28.38 °C. The hottest and coolest racks stayed the same. In every run, the rack inlet temperatures changed by less than 0.03 K over the last 250 iterations.
The model has clear limits. Rack interiors are porous blocks with a fixed fan flow and a uniform heat source, so the temperature inside a rack is not a module or cell temperature. Walls are adiabatic, so solar gain and night-time losses through the container shell are left out. The HVAC unit is reduced to two grilles with a fixed supply temperature, and its own controls are not modelled. Cable trays, doors and fire suppression hardware are left out. The numbers belong to this model. The pattern, and the way the return path sets it, is what carries over.
10. What to ask for in a container thermal study
For a new container layout, the evidence worth asking for is fairly short. The study should report the inlet temperature of every rack alongside the average and the return, and name the hottest rack and where on its face the peak sits. It should state the rack fan flow it assumed and compare it with the HVAC supply, since that ratio decides how much air is recirculated. It should show the flow path from the supply to the return in a plan and a section, because that path decides which rack sits downstream of the others.
When a site already has one rack running warm, the same model can test the cheap options before anyone orders a bigger unit: grille positions, blanking over and between racks, the gap behind the rows, and baffles that guide the supply into the aisle. Case B is a reminder that more air is the expensive answer and may not move the hot rack at all.
Where Shirsh fits
At Shirsh Technosolutions we carry out CFD studies of BESS containers and battery rooms with ANSYS Fluent and OpenFOAM, covering HVAC layout, rack inlet temperatures, recirculation paths and the effect of solar load and ambient conditions. If you are laying out a container or chasing a rack that runs warmer than the rest, please get in touch.
References
T. Waldmann, M. Wilka, M. Kasper, M. Fleischhammer, M. Wohlfahrt-Mehrens, "Temperature dependent ageing mechanisms in Lithium-ion batteries: A Post-Mortem study", Journal of Power Sources 262, 2014 (background only; no numbers taken from it).
Worked example: OpenFOAM v1912 runs of cases A to D and the case A mesh check, computed for this article on 3 November 2026. Generic container; not any project.
Click to view full size
Related case studies

Want to Apply This to Your Product?
Our engineers can help you implement these techniques on your specific components and assemblies.
Get insights like this in your inbox
Engineering deep-dives, simulation tips, and industry analysis. No spam, unsubscribe any time.