BESS Container Gas Venting: What CFD Adds to NFPA 69 Ventilation
A dilution ratio says a ventilated BESS container stays at 10 percent of the lower flammable limit. A small OpenFOAM study of a 20 ft container shows hydrogen layering under the roof, a fifth of the air above the NFPA 69 limit in the usual fan layout, and how moving the same fan changes the picture.
Read the full article below for the methodology, the data, and the engineering decisions behind it.
Ask how a BESS container is protected against flammable gas and the answer usually comes as a single number. The exhaust fan moves so many cubic metres an hour against a release of so many litres a second from one failing module, and the ratio keeps the room well under the lower flammable limit. On paper the room is safe.
That calculation quietly assumes the gas spreads evenly through the container. Hydrogen, which makes up a large share of lithium-ion vent gas, does not oblige. It rises and gathers under the roof, wherever the airflow lets it stay. This article runs a small CFD study of a 20 ft container to show what the well-mixed number hides, and why the position of the fan matters as much as its size.
1. What the codes ask for
NFPA 855 asks for explosion control on energy storage systems that can release flammable gas in thermal runaway. There are two routes. One is deflagration venting to NFPA 68, where panels open and relieve the pressure if the gas ignites. The other is explosion prevention to NFPA 69, where ventilation keeps the gas concentration at or below 25 percent of the lower flammable limit (LFL), so that ignition never gets a flammable mixture to work with.
The gas itself is characterised by testing to UL 9540A, which reports how much gas a cell or module gives off in thermal runaway and what it is made of. That test result is the starting point for both routes. For hydrogen alone the LFL is 4 percent by volume, so the NFPA 69 limit works out to 1 percent.
Both routes depend on where the gas actually is. A ventilation design is judged on the worst place in the room, not the average. A vent panel only helps if the flammable cloud can reach it. Neither question can be answered from a single dilution ratio.
2. The worked example
We modelled a 20 ft container with internal dimensions of 5.9 m by 2.35 m by 2.4 m high. Two rows of battery racks, 0.6 m deep and 2.1 m high, run along the long walls with a 1.15 m aisle between them and 0.6 m of clear space at each end. The racks were treated as solid blocks, which leaves about 21 m³ of free air.
Fresh air enters through a louvre in one end wall, 0.5 m high and 0.75 m wide, sitting 0.2 m above the floor. The exhaust fan draws 0.25 m³/s, which is 900 m³/h or about 27 air changes an hour on the gross volume of the container. The fan opening is 0.4 m square, and we tried it in three places.
Case A: high on the far end wall, the layout most people would draw first.
Case B: low on the far end wall, at the same height as the louvre.
Case C: high on the louvre end wall, directly above the louvre.
A failing module releases gas at 1 litre per second from a 0.2 m square patch on the aisle face of one rack, 1.2 m to 1.4 m above the floor and 2.1 m from the louvre end. The gas was taken as hydrogen. Real vent gas is a mixture with its own LFL from the UL 9540A test, but hydrogen is the lightest and most buoyant part of it, and the one that decides where a ceiling layer forms. Case D keeps the case C fan and moves the release to 4.1 m from the louvre end.

The container model. The louvre is the same in every case. Fans A, B and C are the three exhaust positions, and the stars mark the two release points.
The flow was solved in OpenFOAM as a transient, buoyant, turbulent flow with the k-omega SST model. Since the hydrogen fraction stays low away from the release, its effect on density was handled with the Boussinesq approach, where the mixture density falls by 0.93 times the hydrogen volume fraction. Each case ran for 900 s of real time, nearly seven times the 133 s it takes the fan to move one container volume. The main mesh used 10 cm cells. As a check, case A was mapped onto a mesh with cells of about 6.7 cm and run for a further 300 s.
3. The well-mixed answer, and what the model shows
The hand calculation is quick. One litre a second of hydrogen into 0.25 m³/s of exhaust is 0.4 percent by volume, which is 10 percent of the LFL. That is well inside the NFPA 69 limit of 25 percent, and it is the same for all four cases, because the fan flow and the release are the same.
The CFD does agree with that number in one place. At the fan, the average concentration came out between 10.1 and 11.9 percent of the LFL in cases A, C and D, which is what a mass balance says it must be once the room has settled. Everywhere else the picture is very different.

Hydrogen concentration on a vertical plane along the middle of the aisle, as a percentage of the LFL, with arrows for the in-plane flow direction. The black line marks 25 percent of the LFL. Case B is shown after 30 minutes, the others after 15.
The table gives the numbers. Values are averaged over the last three saved snapshots of each run, 50 s apart. The ceiling layer is the top 0.3 m of the container, which is the 0.3 m gap above the racks.
Case | Average at fan (% LFL) | Volume average (% LFL) | Free volume above 25% LFL (%) | Ceiling layer average (% LFL) | Ceiling at louvre end (% LFL) |
|---|---|---|---|---|---|
Well-mixed estimate | 10 | 10 | 0 | 10 | 10 |
A, fan high at far end | 10.6 | 15.7 | 20.5 | 47.1 | 53.1 |
B, fan low at far end (30 min) | 8.7 | 104.1 | 72.6 | 238.6 | 243.1 |
C, fan high above louvre | 10.1 | 3.2 | 2.7 | 9.9 | 20.0 |
D, as C, release moved to 4.1 m | 11.9 | 5.7 | 4.0 | 16.9 | 20.3 |
Case A is the one to look at first, because it is the layout that would pass most reviews without comment. The air at the fan is at the well-mixed value, yet a fifth of the free volume sits above the NFPA 69 limit, and the ceiling layer averages 47.1 percent of the LFL. The worst part of that layer is not near the fan at all. It is over the louvre end, at 53.1 percent, where the incoming air runs along the floor and nothing sweeps the roof.

The same results in three dimensions, with the near rack row hidden. The light surface is 25 percent of the LFL, so everything above it is over the NFPA 69 limit. The dark surface is the LFL itself.

Left: share of the free volume above 25 percent of the LFL. Right: average concentration in the top 0.3 m, against the well-mixed answer and the NFPA 69 limit.
4. A low fan exhausts the cleanest air in the room
Case B moves the same fan to the bottom of the far wall. Fresh air now enters low and leaves low, and the hydrogen floats above that stream without being drawn into it. At 15 minutes the ceiling layer averaged 180.8 percent of the LFL and the fan was taking out air at only 6.1 percent. After 30 minutes the layer was at 238.6 percent and still growing, with the fan at 8.7 percent.
That gap between the two numbers is the whole problem. Until the gas layer grows down to the level of the fan, the fan cannot remove the gas as fast as it arrives. In this model, that meant more than half the free volume above half the LFL, and a roof layer that was flammable on its own. Every one of those cubic metres was ventilated at 27 air changes an hour.
Low exhaust fans do turn up on real containers, usually because the HVAC unit or the door leaves no room higher up. For a heavier-than-air gas that would be fine. For hydrogen, the exhaust has to be at the roof.
5. Same fan, different loop
Case C was the surprise. Moving the fan from the far end to the top of the louvre wall cut the share of volume above the NFPA 69 limit from 20.5 percent to 2.7 percent, with exactly the same airflow.
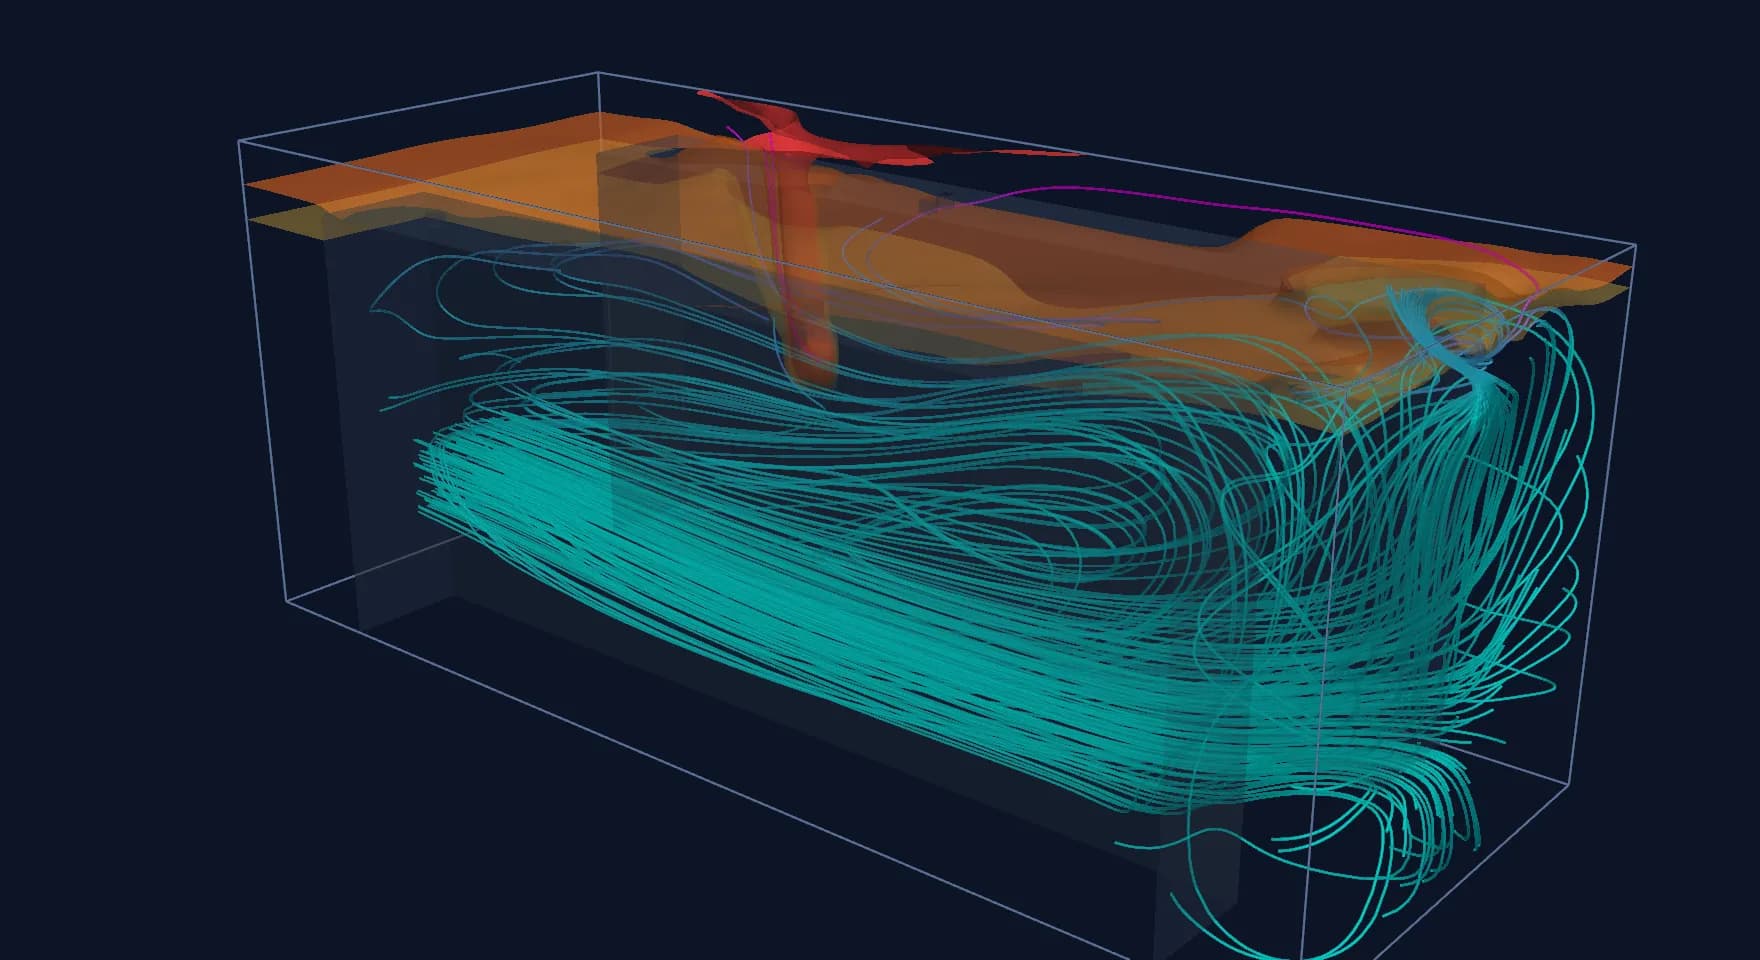
The flow plots show why. With the fan above the louvre, the incoming air runs along the floor to the far end, rises, and comes back along the ceiling to the fan. That return path sweeps the whole roof towards the exhaust. In case A the air takes a shorter route, low in at one end and high out at the other, and the roof over the louvre end becomes a slow eddy that the gas fills.
Tracer particles carried by the settled flow of each case. Blue dots are fresh air from the louvre and red dots are gas from the release. In case B the gas stays under the roof; in case C it is drawn straight to the fan.
We do not draw a general rule from one container. Case D moved the release to 4.1 m from the louvre, closer to the far end, to see whether case C was only good because the release happened to sit near the fan. It held up reasonably well, with 4.0 percent of the volume above the limit, but the ceiling average rose from 9.9 to 16.9 percent of the LFL. A door on the side wall or an HVAC unit blowing across the roof could change the loop completely. The point is that the layout has to be checked for releases at more than one place, and a dilution ratio cannot do that.
6. Where the peak sits, and what a detector sees
The highest concentrations away from the release patch itself were in the plume rising up the rack face, about half a metre above the release. In cases A, B and C this plume was above the LFL. No practical ventilation rate removes that region, because the gas is still close to pure when it leaves the module. That is one reason ventilation is paired with ignition control, and where it is used, with deflagration venting.
The mesh check on case A is worth reading carefully. The coarse and fine meshes agreed well on the volume figures: the volume average went from 15.7 to 15.6 percent of the LFL and the share above 25 percent from 20.5 to 20.2. The ceiling layer average moved from 47.1 to 57.6 percent, and a single ceiling point at mid-length moved from 50.0 to 80.0 percent. Point values in a thin, buoyant layer are sensitive to the mesh and also wander with time in the transient run. A detector set point taken from one CFD probe value should be treated with that in mind.
For detector placement the useful output is the map, not a number. In case A a ceiling detector near the fan would read about half of what one over the louvre end sees. Detectors belong where the layer forms first and stays longest, and that is not always where the drawings put them.
7. What this means for NFPA 68 vent panels
Deflagration vents raise the same question from the other side. A panel relieves pressure from the cloud that ignites, so it needs to sit where the cloud is. A layer under the roof argues for roof or high-wall panels near where the layer is thickest. Where NFPA 68 is used with a partial-volume approach, the fraction of the container that is filled with a flammable mixture is an input to the vent area, and a CFD map of the kind shown here is one way of supporting that fraction.
The model in this article is a teaching example. It treats the racks as solid, the gas as hydrogen at room temperature and the release as a steady 1 litre per second. A design study would use the UL 9540A gas volume and composition, the release rate over time, the real rack and door geometry, the HVAC unit and its control logic, and the gas detection and fan start sequence.
8. A reviewer's checklist
When we review gas ventilation for a BESS enclosure, these are the questions we ask.
What you see in the report | Why it matters | What to ask for |
|---|---|---|
Only a dilution ratio against 25% LFL | Assumes perfect mixing; local pockets can be several times higher | Concentration map, share of volume above 25% LFL, ceiling layer values |
Exhaust fan low on the wall | Buoyant gas stays above the exhaust stream | Fan at the roof, or proof that the layer is captured |
One release location studied | The worst pocket moves with the release | Releases at the louvre end, mid-length and far end |
Gas taken as a generic mixture with no source | LFL and buoyancy depend on composition | UL 9540A gas volume and composition, stated in the inputs |
Detector set points from single probe values | Point values in a thin layer depend on mesh and time | Mesh check on the layer, and detector positions taken from the map |
Vent panels placed for structural convenience | Panels must see the flammable cloud | Panel positions checked against where the layer forms |
Where Shirsh fits
A container that passes the dilution check can still hold a flammable layer under its roof. In this small study the deciding factor was where the fan sat, with its size unchanged across all four cases.
Shirsh TechnoSolutions carries out CFD studies of gas dispersion and ventilation for BESS containers and enclosures, alongside thermal and HVAC airflow work. If you have a container layout to check, a vent panel arrangement to justify or a ventilation report to review, please get in touch.
Click to view full size
Related case studies


Want to Apply This to Your Product?
Our engineers can help you implement these techniques on your specific components and assemblies.
Get insights like this in your inbox
Engineering deep-dives, simulation tips, and industry analysis. No spam, unsubscribe any time.