Annex 1 Clean-Up Period: Where a 20-Minute Pass Can Mislead
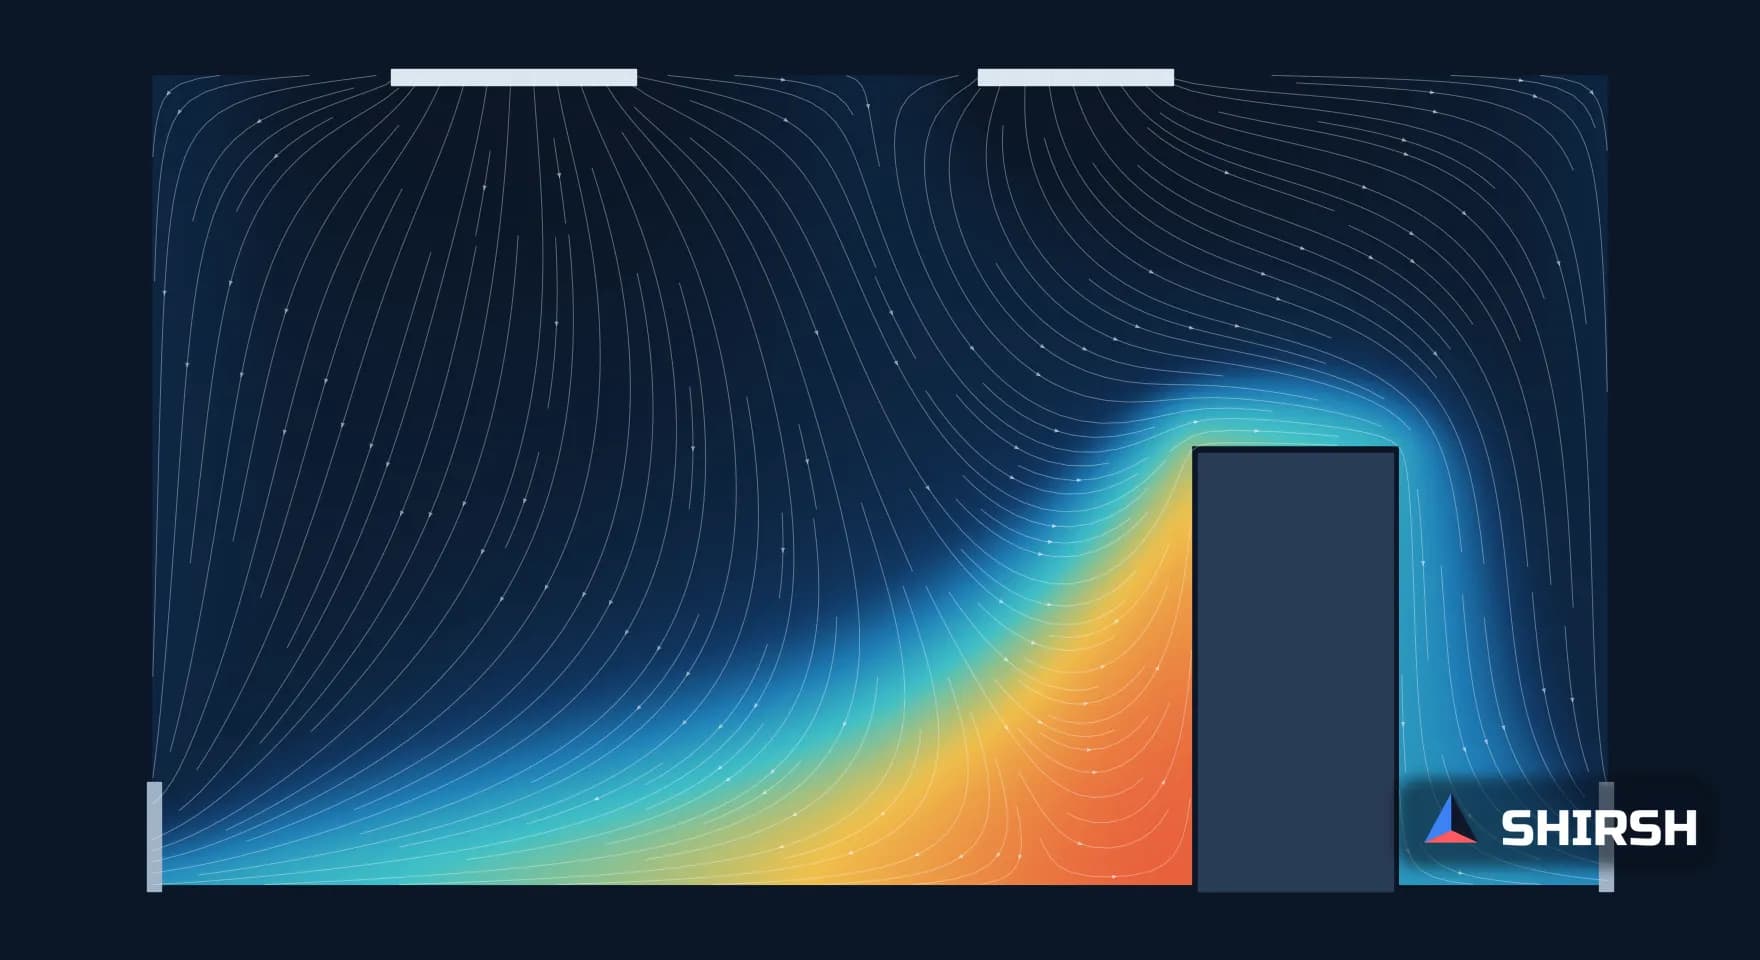
EU GMP Annex 1 sets a clean-up guidance of less than 20 minutes, but the result only holds where it is measured. A two-zone check on a generic Grade B room shows the main zone clearing in under 10 minutes while a poorly swept pocket takes 30.
Read the full article below for the methodology, the data, and the engineering decisions behind it.
Most Grade B and C rooms pass their clean-up check. A particle counter is placed, operations stop, the count falls below the at-rest limit inside the time the procedure allows, and the room is qualified. The question this note asks is where that counter was standing, and whether a passing number there says anything about the corner behind the equipment.
EU GMP Annex 1 (2022) put a number on the clean-up period and asked for it to be determined during qualification. Below we set out what the text says, how it differs from the recovery test in ISO 14644-3, and then run a small calculation to show why a single location can pass comfortably while part of the room is still well short of the limit.
1. What Annex 1 asks for
Paragraph 4.29 says cleanrooms are classified at rest and in operation, and that the at-rest limits of Table 1 should be reached after a "clean up" period on completion of operations. That period is a guidance value of less than 20 minutes. It should be determined during qualification, documented and followed in procedures.
Table 1 in paragraph 4.27 sets the size of the job. For particles of 0.5 µm and larger, a Grade B room may hold 352,000 per m³ in operation and 3,520 per m³ at rest. That is a reduction of 100 to 1. For Grade C the limits are 3,520,000 and 352,000 per m³, a reduction of 10 to 1.
Two other paragraphs point at the same physics. Paragraph 4.25 lists the recovery test and the airflow direction test and visualisation among the tests for cleanroom qualification. The note under paragraph 4.32 says that for grades with non-unidirectional airflow, a recovery measurement should replace the velocity test at requalification, which is due at least every 6 months for Grades A and B and every 12 months for Grades C and D. Paragraph 4.15 asks for airflow patterns to be visualised so that air does not pass from lower to higher grade areas, and paragraph 4.31 asks for monitoring locations to take account of those visualisation studies.
Item | Annex 1 (2022) | What it means in practice |
|---|---|---|
Clean-up period | 4.29: guidance value of less than 20 minutes, determined at qualification | Measured from the in-operation state to the at-rest limits |
Size of the reduction (0.5 µm) | 4.27, Table 1: Grade B 352,000 to 3,520 per m³; Grade C 3,520,000 to 352,000 per m³ | 100:1 for Grade B, 10:1 for Grade C |
Recovery test | 4.25 qualification test; 4.32 note: replaces velocity testing where airflow is not unidirectional | The routine evidence that a mixing room is still being swept |
Requalification interval | 4.32: at most 6 months for Grades A and B, 12 months for Grades C and D | The clean-up evidence is repeated on that cycle |
Airflow visualisation | 4.15 and 4.31 | Patterns should inform where monitoring and testing are done |
2. Clean-up period and recovery test are different measurements
The two are easy to mix up. The Annex 1 clean-up period starts in operation, with people and equipment running, and ends when the at-rest limits are met. The recovery test in ISO 14644-3:2019 is done at rest. A controlled aerosol challenge is introduced, and the preferred result is the 100:1 recovery time, the time for the concentration to fall by a factor of 100. ISO recommends it for non-unidirectional airflow and not for unidirectional zones. The ECA Academy's commentary of June 2023 makes the same distinction and concludes that both have to be done.
They have one thing in common. Each is a measurement of decay at the points where the counter is placed, and neither says by itself how many points are needed.
3. A quick check: the well-mixed estimate
If the room air is perfectly mixed and the supply is clean, the concentration falls exponentially and the time for a reduction R is 60 × ln(R) / N minutes, where N is the air change rate per hour. We solved this for this note.
For the Grade B reduction of 100:1, 20 air changes per hour give 13.8 minutes and 10 give 27.6 minutes. To get inside 20 minutes, the air reaching the point being tested needs an effective rate of at least 13.8 changes per hour. For the Grade C reduction of 10:1 the figure halves to 6.9 changes per hour. Most Grade B rooms are designed well above that, which is why the clean-up test is usually passed with time to spare.

Figure 1. Well-mixed estimate computed for this note. The time for a 100:1 reduction falls below the 20 minute guidance once the effective air change rate at the point exceeds 13.8 per hour.
4. When part of the room is not mixed
The well-mixed figure uses the room's total air change rate. A point behind a cabinet, under a bench or in a corner between two returns gets much less fresh air than that. To show the effect, we split a generic 72 m³ Grade B room at 40 air changes per hour into a main zone and a pocket holding 10% of the volume. The pocket gets no supply air of its own and exchanges air only with the main zone. We varied that exchange and solved both zones together.
With the pocket well swept, at a local exchange of 60 per hour, both zones reach 100:1 in under 9 minutes: 7.5 minutes in the main zone and 8.9 minutes in the pocket. At 20 per hour the main zone still clears in 8.6 minutes and the pocket takes 16.6 minutes, inside the guidance but with little margin. At 10 per hour the main zone clears in 9.1 minutes and the pocket takes 30.0 minutes. At 5 per hour the pocket needs about 57 minutes.
In every case the main zone, which is roughly what a counter near the return grille sees, passes in well under 20 minutes. The room's total air change rate is the same 40 per hour throughout. Only the sweep of one tenth of the volume changes, and the counter in the main zone barely notices.

Figure 2. Two-zone check computed for this note. Solid lines: the pocket. Dashed lines: the main zone. The room passes the 20 minute guidance where the main zone is measured, while the pocket at a local exchange of 10 per hour takes 30.0 minutes.
5. What this means for a qualification protocol
The calculation is deliberately simple, and real rooms are neither one zone nor two. It does make a practical point that sits comfortably with the text of Annex 1. The clean-up result belongs to the locations where it was measured, so the choice of those locations is part of the result.
For a Grade B or C room, the evidence we would want to see is fairly short. The airflow visualisation required by paragraph 4.15 should be used to find the poorly swept areas, behind and beside large equipment and in corners away from both supply and return. At least one clean-up and recovery location should sit in the worst of those areas, and the protocol should say why it was chosen. The test should be repeated when equipment is moved, because a cabinet moved half a metre can create or remove a pocket. Where the room is still on drawings, a CFD study of the layout can map the local age of air or the local clean-up time before anything is built, so that the qualification locations are chosen on evidence rather than habit.
Where Shirsh fits
At Shirsh Technosolutions we carry out CFD studies of cleanrooms and filling areas with ANSYS Fluent and OpenFOAM, including local air change effectiveness, clean-up and recovery maps, and the choice of smoke study and particle counter locations. Our earlier Insight on Grade A zones under a laminar airflow unit covers the unidirectional side. If you are preparing a Grade B or C room for qualification or requalification, please get in touch.
References
EU GMP Annex 1, Manufacture of Sterile Medicinal Products, 2022 (in operation from 25 August 2023), as published by PIC/S as PS/INF 26/2022 (Rev. 1): paragraphs 4.15, 4.25, 4.27 (Table 1), 4.29, 4.31 and 4.32.
ISO 14644-3:2019, Cleanrooms and associated controlled environments, Part 3: Test methods (recovery test, 100:1 recovery time), as summarised by Beckman Coulter, "What is the ISO 14644-3 cleanroom recovery test?".
ECA Academy, "Clean-up Phase and Recovery Time: is there a Difference?", GMP News, 14 June 2023.
Single-zone and two-zone calculations: fe/calc_cleanup.py, run 1 November 2026. Generic room; not any project.
Click to view full size
Related case studies


Want to Apply This to Your Product?
Our engineers can help you implement these techniques on your specific components and assemblies.
Get insights like this in your inbox
Engineering deep-dives, simulation tips, and industry analysis. No spam, unsubscribe any time.