Grade A Under a LAF: Where Smoke Studies and CFD Each Fool You
An air speed check at the working position can look better with a hopper over the vials than with the table empty, while the vials get no first air at all. A small OpenFOAM study of a Grade A zone under a laminar airflow unit shows how a hopper or an operator's arm turns the flow over the critical zone, and what a smoke study and a CFD model can each tell you.
Read the full article below for the methodology, the data, and the engineering decisions behind it.
Most Grade A zones under a laminar airflow unit are qualified with two things: an anemometer reading near the filter face and a smoke study video. Both can look fine while the open vials on the table are breathing air that has just come off a hopper or an operator's sleeve.
EU GMP Annex 1 has a name for the air that matters, first air, and it is not the same as air speed. This article uses a small CFD study of a filling table under a laminar airflow unit to show how an object above the critical zone changes where the air at the vials comes from, what an air speed check reports while it happens, and where a smoke study and a CFD model can each mislead you.
1. What Annex 1 asks for
The 2022 revision of EU GMP Annex 1 is specific about unidirectional airflow. Paragraph 4.30 asks for a homogeneous air speed in the range of 0.36 to 0.54 m/s, as a guidance value, at the working position, unless otherwise scientifically justified in the contamination control strategy. The same paragraph says airflow visualisation studies should correlate with the air speed measurement.
Paragraph 4.15 asks for airflow patterns to be visualised, at rest and in operation, wherever unidirectional airflow is required, with video recordings of the patterns retained. Paragraph 7.18 brings the operators in: obstruction of the path of the unidirectional, first air should be avoided, and a review of airflow visualisation studies should be considered as part of their training.
The Annex 1 glossary defines first air as filtered air that has not been interrupted before it contacts exposed product and product contact surfaces. So the question at the critical zone is whether that air has touched anything on its way down from the filter. Air speed on its own does not answer it.
There is also a practical debate about where to measure. Paragraph 4.30 says working position. Many sites measure 150 to 300 mm from the filter face, as ISO 14644-3 describes, because the reading there is more repeatable. As the worked example shows, the two places can give quite different numbers.
2. The worked example
We modelled one Grade A zone in a Grade B room. The room is 3.0 m long, 2.4 m wide and 2.7 m high. A ceiling HEPA face of 1.68 m by 1.08 m supplies air downwards at 0.45 m/s, and flexible curtains hang from its edges down to 1.56 m above the floor. Below it is a filling table 1.44 m by 0.84 m with its top at 0.90 m. The critical zone, where open vials would stand, is a 0.24 m square at the centre of the table. An operator stands at the front of the table, outside the curtain. Background Grade B air enters through two ceiling diffusers outside the curtains at 0.30 m³/s in total and leaves through low-level returns on the two end walls.

The model. Left: elevation through the critical zone with the HEPA face, the curtains, the table and the two hopper positions. Right: section through the critical zone with the operator at the front and the arm used in case C. The red block marks the critical zone where open vials would stand; it is an air volume in the model, not a solid.
Five cases were run.
Case A: empty work zone, HEPA face velocity 0.45 m/s.
Case B: a hopper, 0.24 m in each direction, mounted directly above the vials with its underside at 1.26 m.
Case C: no hopper, but the operator's arm reaches in over the vials at 1.08 to 1.20 m above the floor.
Case D: the same hopper as case B, moved 0.48 m to one side so that it no longer sits above the vials.
Case E: empty work zone with the HEPA face velocity reduced to 0.30 m/s, below the Annex 1 guidance range.
The flow was solved in OpenFOAM as steady, isothermal, turbulent flow with the k-omega SST model. The mesh used 6 cm cells, between 88,440 and 88,504 cells depending on the case. The steady solver does not settle to a single answer when a wake forms behind an object, so every result here is an average of 11 snapshots taken between iterations 1,000 and 1,500.
To find where the air at the vials comes from, we took 49 points on a grid over the critical zone, 0.06 m above the table, and traced each one backwards along the streamlines of the averaged flow. Each path is then sorted into one group. First air reaches the HEPA face without passing within 0.07 m of the hopper, the arm or the operator and without first running along the table. The other groups are air that ran over the table top before reaching the vials, air that passed the hopper, arm or operator, and air held in a recirculating wake that never traces back to the filter.
3. Air speed at the working position
The first table gives the air speed results. The working position is taken as a plane 0.30 m above the table top, over the full table. The filter plane is 0.25 m below the HEPA face, inside the ISO 14644-3 distance.
Case | Mean downward speed 0.25 m below the filter (m/s) | Mean air speed at the working position (m/s) | Working position points within 0.36 to 0.54 m/s (%) | Spread of speed at the working position, CoV (%) |
|---|---|---|---|---|
A, empty, 0.45 m/s | 0.43 | 0.32 | 27.5 | 17.4 |
B, hopper above vials | 0.43 | 0.32 | 58.7 | 40.4 |
C, arm over vials | 0.43 | 0.32 | 27.7 | 17.6 |
D, hopper moved aside | 0.43 | 0.32 | 30.9 | 27.6 |
E, empty, 0.30 m/s | 0.29 | 0.21 | 0.0 | 16.8 |
Near the filter the picture is simple. Every case at 0.45 m/s reads 0.43 m/s, comfortably inside the range, and that is the number most qualification reports carry.
At the working position, in the empty case A, the mean speed has dropped to 0.32 m/s and only 27.5 percent of the points are inside 0.36 to 0.54 m/s. Nothing is wrong with the unit. The air has come 1.5 m from the filter, the curtains stop at 1.56 m so the column starts to spread, and 0.30 m above a solid table the air is already slowing down and turning sideways. A site that measures here will see lower numbers than at the filter face, and the contamination control strategy has to say which place it means and why.
Case B is the uncomfortable one. With the hopper in place, 58.7 percent of the working position points are inside the range, more than double the empty case. Air squeezed round the hopper speeds up, and an anemometer moved across the table would see more readings in the band. The spread of speed, measured by the coefficient of variation, also rises from 17.4 to 40.4 percent, which is the honest sign that the flow is no longer homogeneous. A pass on speed alone says very little about the vials.
4. Where the air at the vials comes from
The second table gives the back-trace results for the 49 points over the critical zone.
Case | First air (%) | Ran over the table first (%) | Passed the hopper, arm or operator (%) | Held in a wake (%) | Vertical air speed at the vials (m/s) |
|---|---|---|---|---|---|
A, empty, 0.45 m/s | 100 | 0 | 0 | 0 | 0.05 downward |
B, hopper above vials | 0 | 51.0 | 30.6 | 18.4 | 0.06 upward |
C, arm over vials | 12.2 | 0 | 87.8 | 0 | 0.03 downward on average, upward at 21.9 % of points |
D, hopper moved aside | 100 | 0 | 0 | 0 | 0.06 downward |
E, empty, 0.30 m/s | 100 | 0 | 0 | 0 | 0.04 downward |
In case A every path from the vials goes straight back up to the HEPA face, in about 6.0 s on average. Close to the table the air is moving slowly, 0.05 m/s downward at 0.06 m above the top, because it is stagnating against the table. That low number is normal and is one more reason to be careful about where a velocity is quoted.

Averaged air speed with in-plane streamlines on an elevation through the critical zone (top row) and a section through it from the operator side (bottom row), for cases A to D. The red outline is the critical zone. In case B the flow splits round the hopper and turns back up over the vials.
In case B none of the 49 paths is first air. The hopper casts a wake about as wide as itself, and in the averaged flow the air directly over the vials is rising, at 0.06 m/s upward on average and upward at every sample point. About half of the paths, 51.0 percent, arrive along the table top from the sides, so that air has already swept over the table surface before it reaches the vials. Another 30.6 percent pass close to the hopper, and 18.4 percent are held in the recirculating wake underneath it. A particle shed from the underside of the hopper has a direct route to the open vials.

Where the air arriving at the critical zone comes from. Each bar splits the 49 back-traced paths into first air from the HEPA face, air that ran over the table first, air that passed the hopper, arm or operator, and air held in a recirculating wake.
Case C shows the same thing with the operator's arm. Of the 49 paths, 87.8 percent pass the arm before they reach the vials. The 12.2 percent that are still first air arrive at the edge of the critical zone furthest from the operator, beyond the tip of the arm. The arm is narrow, so the flow closes in behind it and the mean vertical speed at the vials is still downward, but at 21.9 percent of the sample points the air is rising.
Moving the hopper by 0.48 m in case D restores first air at every one of the 49 points. Its wake is still there, and the lowest working position reading, at the edge of the hopper, is now an upward one, but the wake falls on bare table instead of on product. This is exactly the layout question that paragraph 7.18 points at, and it is far cheaper to settle on a drawing than after the machine is installed.
Case E is a useful caution in the other direction. With the face velocity cut to 0.30 m/s, no working position point is inside the guidance range, yet every path from the vials is still first air and the transit time from the filter rises to 9.0 s. In a still, isothermal model with nothing in the way, slower air is still undisturbed air. In a real room, with people moving and warm equipment, a weaker downflow has less margin to push back against those disturbances, and the model cannot show that.
5. What a smoke study shows, and where each method fools you
A good smoke study would show case B clearly. The smoke would split round the hopper, curl back up under it and drift sideways along the table, and an experienced reviewer would ask for the hopper to move. In that sense smoke and CFD agree.
The trouble starts with the subtler cases. In case C the smoke still goes down, past the arm and onto the vials, and on a video that looks like good unidirectional flow. The point that matters is that the air has touched the arm on its way, and a smoke video does not label that for you. The smoke generator adds momentum of its own and a camera sees only one plane. An at-rest study, of course, does not show the arm at all.
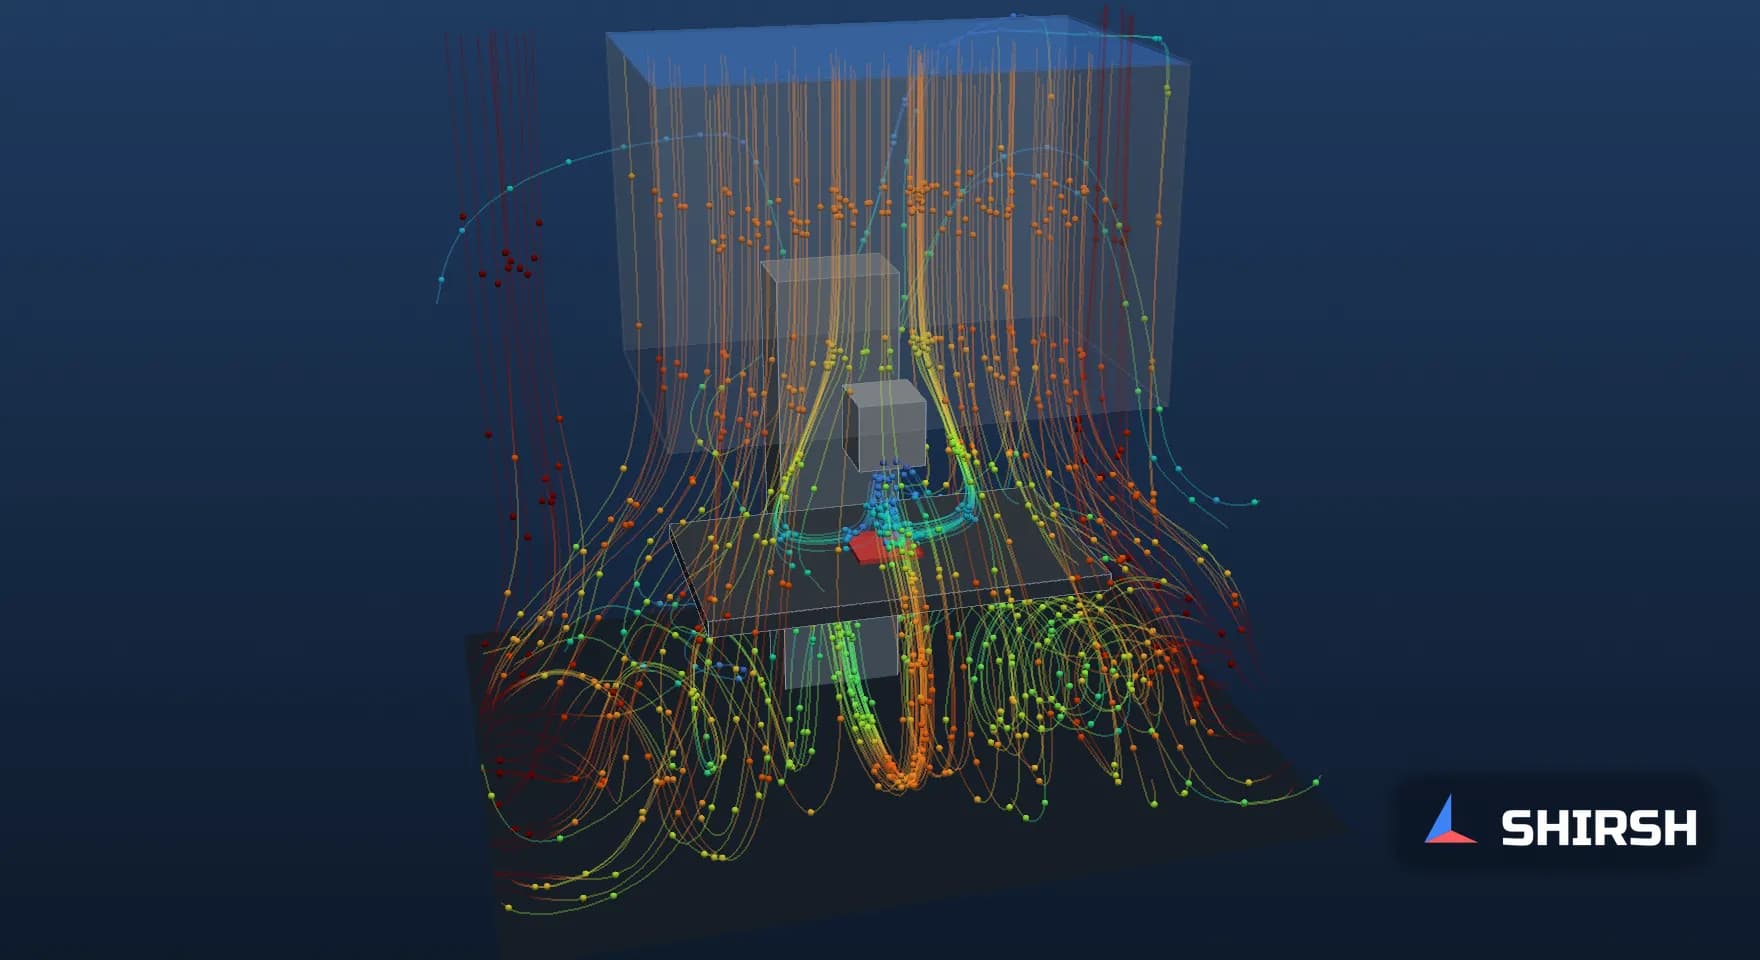
3D streamline animation of all five cases, A to E. Particles follow streamlines of the averaged flow and are coloured by air speed. Watch the air at the vials come straight from the filter in case A, rise off the table under the hopper in case B, pass the operator's arm in case C, and come back to the vials once the hopper is moved aside in case D. The animation illustrates the averaged flow field; it is not a transient result.
CFD has its own blind spots, and a reviewer should know them. This model is steady and averaged, so it shows where the air goes on average and not how a wake sheds from moment to moment. It is isothermal, so warm equipment and the operator's body heat are absent. The arm does not move, and the HEPA face delivers perfectly even flow between rigid curtains. The back-traces follow the averaged streamlines and ignore turbulent mixing, which in reality smears the boundaries between the groups. For these reasons the CFD should be used to choose the layout and the smoke study positions, and the smoke study, in operation, should confirm what the model predicted.
6. How far to trust the numbers
Case B, the most sensitive case, was repeated with the mesh refined to 3 cm cells across the whole zone under the curtains, 276,166 cells in all. First air at the vials stayed at 0 percent and the air over the vials was still rising at every sample point, now at 0.09 m/s on average. The split of the paths moved: air that ran over the table went from 51.0 to 61.2 percent, air that passed the hopper from 30.6 to 24.5 percent and air held in the wake from 18.4 to 14.3 percent. The share of working position points inside 0.36 to 0.54 m/s went from 58.7 to 59.7 percent, and the filter plane reading from 0.43 to 0.44 m/s.
The conclusions do not depend on the mesh. The individual percentages do move by up to about 10 points, so they should be read as a picture of the flow and not as a measured property of a real line.
7. A reviewer's checklist
When we review a Grade A airflow study, a smoke study protocol or a CFD report for a filling line, these are the questions we ask.
What you see in the report | Why it matters | What to ask for |
|---|---|---|
Air speed quoted near the filter face only | The speed at the working position can be much lower, and less even | Readings at the working position as well, with the spread, and a statement in the CCS of which one is controlled |
Mean speed inside 0.36 to 0.54 m/s, so the zone passes | An obstruction can raise local speeds while removing first air | Homogeneity across the zone and a first air check at each critical point |
Smoke study recorded at rest | Arms, tools and moving parts are absent | In-operation studies covering the interventions that happen over open product |
One camera angle | A wake seen side-on can look like downflow | Two views and close-ups at each critical point |
CFD with one converged picture | Wakes behind objects are unsteady | Averaged results, a mesh check and the limits of the model stated |
Equipment layout fixed before any airflow review | Moving a hopper on paper is cheap, on the floor it is not | An airflow check of the layout at design stage, before the smoke study |
Where Shirsh fits
In this small study a hopper above the vials left no first air at the critical zone while more of the working position readings fell inside the Annex 1 guidance range than with the table empty.
Shirsh Technosolutions carries out CFD studies of Grade A and B zones, filling lines, isolators, laminar airflow units and cleanroom layouts, from first air checks at critical points to smoke study planning and review of airflow visualisation reports. If you have a new line layout to check, a smoke study result to explain or an Annex 1 gap assessment to support, please get in touch.
Click to view full size
Related case studies


Want to Apply This to Your Product?
Our engineers can help you implement these techniques on your specific components and assemblies.
Get insights like this in your inbox
Engineering deep-dives, simulation tips, and industry analysis. No spam, unsubscribe any time.