Liquid Cooling Flow Split Across Cold Plates: What CFD Shows
A CDU sees one flow and one pressure, so it cannot tell you whether every cold plate on a rack manifold gets its share. We ran five OpenFOAM cases on an eight-branch manifold to show how the return arrangement and plate pressure drop set the split, and why one fouled plate can hide behind a healthy CDU reading.
Read the full article below for the methodology, the data, and the engineering decisions behind it.
A coolant distribution unit reports one flow and one pressure for the whole rack loop. If both look right, it is easy to assume every cold plate on the manifold is getting its share. The CDU cannot tell you that. It sees the sum, and the sum stays the same whether the water divides evenly or piles into the branches nearest the inlet.
This article works through a small OpenFOAM study of a rack manifold with eight cold-plate branches. It shows how much the split moves with the return arrangement and the plate pressure drop, why reverse return did not fix the imbalance here, and what a single fouled plate looks like from the CDU side.
1. Why the split matters
Each cold plate removes heat at a coolant temperature rise set by its own flow, not the loop average. For a plate rejecting 5 kW into water at 30 °C, the rise is 9.01 K at 8 L/min. At 4.46 L/min, which is what one branch received in case E below, it is 16.17 K. The chip sits above that coolant temperature by the plate's own thermal resistance, so a branch that is short of water runs hotter by roughly the extra rise.
The margin for this has been shrinking. ASHRAE TC 9.9's Thermal Guidelines (5th edition, 2021) define liquid cooling classes W17, W27, W32, W40, W45 and W+ by the upper limit of the facility water temperature. Warmer water classes save chiller energy, and they also leave less headroom between the coolant and the component limit. A flow split that was harmless with cold water can matter with warm water.
2. The worked example
The model is a generic rack manifold, not any particular product. Supply and return headers are square ducts 40 x 40 mm and 1.7 m tall. Eight branches, 20 x 20 mm, run 0.3 m between the headers at a 0.2 m pitch. Each branch carries a cold plate, modelled as a porous zone 0.1 m long whose quadratic resistance is set to give a chosen pressure drop at 8 L/min, the equal share of the 64 L/min total. The coolant is water at 30 °C.
We solved the steady flow with OpenFOAM (simpleFoam, k-omega SST, wall functions) on a 5 mm hexahedral mesh of 51,200 cells. Branch flows were taken from the converged velocity field downstream of each plate, and in every case they add back to 64 L/min within 0.02 L/min.

Figure 1. Worked example. The supply enters at the bottom of the left header. The return leaves at the bottom of the right header (direct return) or at its top (reverse return).
Case | Return arrangement | Plate pressure drop at 8 L/min | Highest branch (L/min) | Lowest branch (L/min) | Spread, % of mean | Manifold pressure drop (Pa) |
|---|---|---|---|---|---|---|
A | Direct return | 1 kPa | 8.45 (branch 1) | 7.82 (branch 8) | 7.96 | 1425.3 |
B | Reverse return | 1 kPa | 8.99 (branch 8) | 7.29 (branch 1) | 21.31 | 1440.8 |
C | Direct return | 0.25 kPa | 9.22 (branch 1) | 7.50 (branches 7 and 8) | 21.53 | 685.4 |
D | Direct return | 10 kPa | branch 1 | branch 8 | 1.01 | 10115.7 |
E | Direct return | 1 kPa, branch 4 at 4 times the loss | 8.91 (branch 1) | 4.46 (branch 4) | 55.65 | 1564.5 |
Spread is the highest branch flow minus the lowest, divided by the mean of 8 L/min. Manifold pressure drop is the average static pressure at the supply inlet relative to the return outlet.
3. Direct return: the near branches take more
In case A the inlet and outlet are both at the bottom. Branch 1, closest to both, gets 8.45 L/min. The top three branches get 7.82 L/min each. A spread of 7.96% is not alarming on its own, but it is already enough to change the coolant rise on the top plate from 9.01 K to 9.23 K for the same 5 kW.

Figure 2. Branch flows from the OpenFOAM runs. The direct-return cases favour the bottom branches; reverse return (case B) swings the excess to the top. With 10 kPa plates (case D) the line is almost flat.
4. Reverse return is not automatically balanced
The usual advice is to fit reverse return so that every branch has the same total path length. Case B does exactly that, with the outlet moved to the top of the return header. The spread went up, from 7.96% to 21.31%, and the excess moved to the top branch at 8.99 L/min while the bottom branch fell to 7.29 L/min.
The header pressures explain it. What drives a branch is the difference between the supply header pressure at its inlet and the return header pressure at its outlet. In the supply header the water slows down as each branch takes its share, and in this model the pressure rises along the height, from 1428.7 Pa at branch 1 to 1529.6 Pa at branch 8 in case A. This is static regain, a momentum effect, and it outweighs friction in a header this short.
With direct return, the return header pressure also rises towards its closed top end, from 80.1 Pa to 484.0 Pa. The two rises partly cancel, and the driving difference falls from 1348.6 Pa at branch 1 to 1045.6 Pa at branch 8. With reverse return the return water accelerates towards the top outlet, so its pressure falls with height, from 481.7 Pa to 83.7 Pa. Now the two trends add, and the driving difference grows from 960.1 Pa at the bottom to 1454.0 Pa at the top.

Figure 3. Section-average static pressure in the two headers. The horizontal gap at each branch height is the pressure that drives that branch.
Reverse return balances a manifold where friction dominates, because then the supply pressure falls along the flow and the return arrangement can mirror it. Where momentum dominates, as with large headers, low velocities in the branches or few branches, it can do the opposite. Which regime a given manifold is in is a calculation, not a rule of thumb.
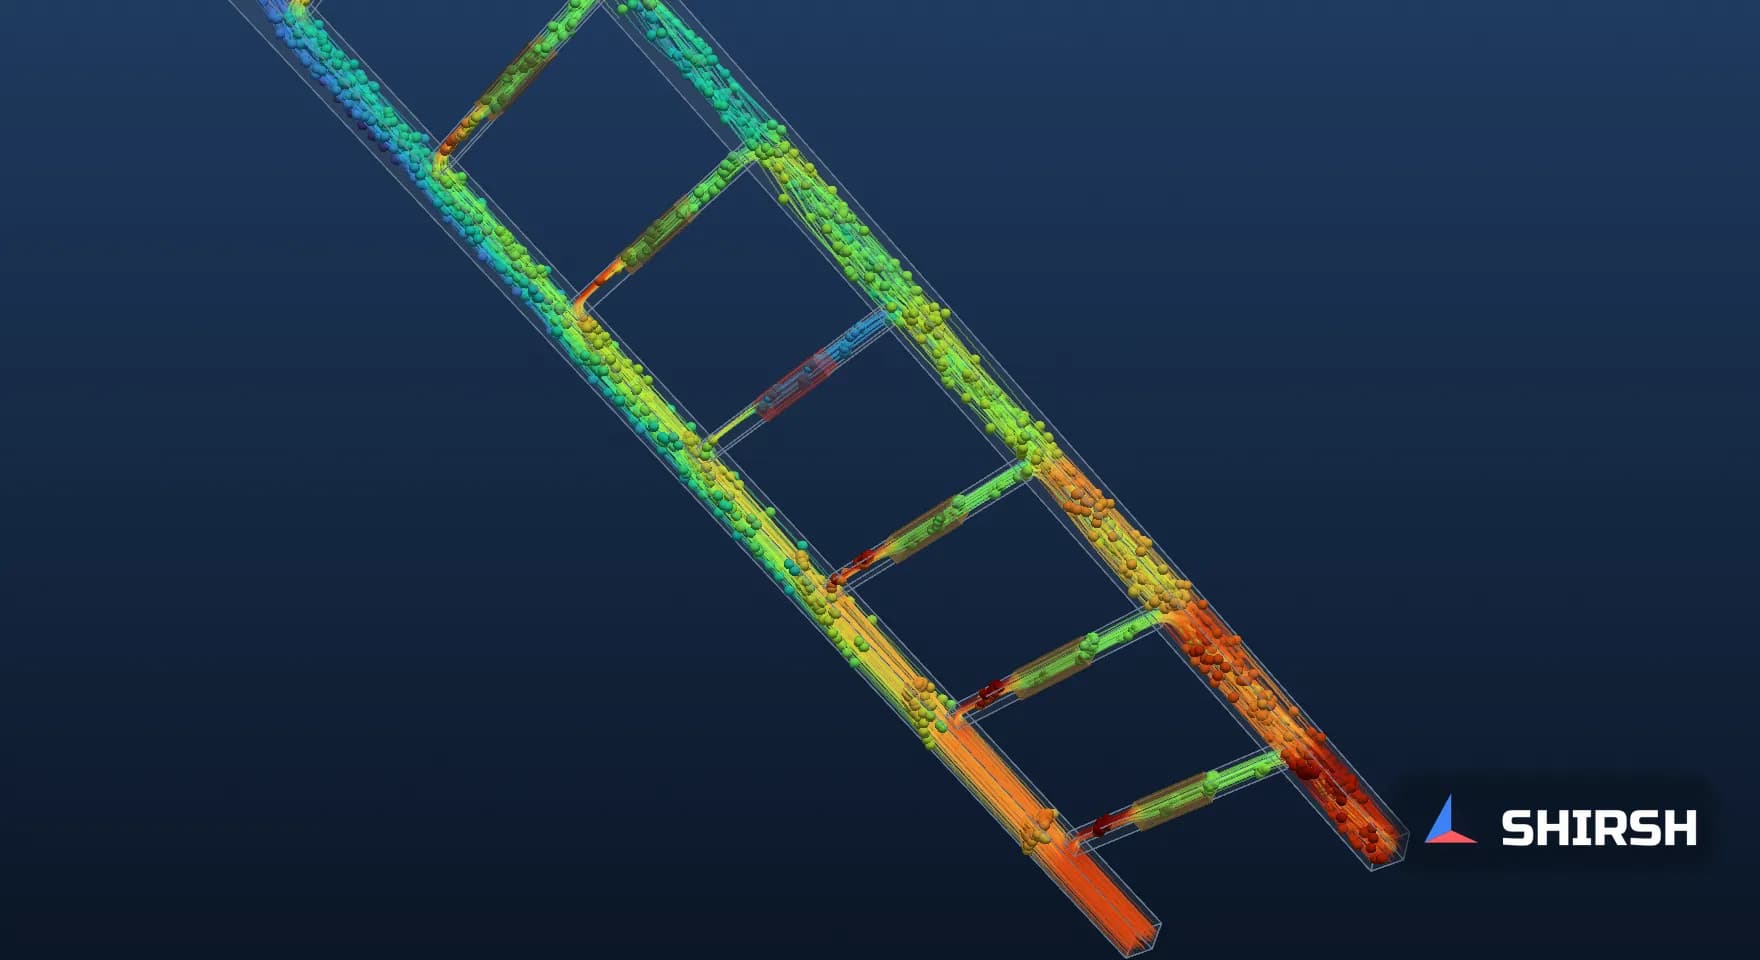
Figure 4. 3D streamline animation of all five cases, A to E. Particles follow streamlines of the converged steady flow field; this is an illustration of that field, not a transient result.
5. Plate resistance does most of the balancing
Cases C and D keep the direct-return layout and change only the plate pressure drop. With low-loss plates at 0.25 kPa, the spread grows to 21.53% and branch 1 takes 9.22 L/min. With 10 kPa plates it drops to 1.01%.
The reason is the same pressure picture. The variation along the headers is of the order of a few hundred pascals in these runs. When each branch needs 10 kPa to pass its share, a few hundred pascals hardly changes anything. When it needs 0.25 kPa, the same variation shifts a lot of water.
Balance has a price. The manifold pressure drop in case D is 10115.7 Pa, 7.1 times that of case A, and the hydraulic power for the manifold alone rises from 1.52 W to 10.79 W. On a real loop the quick disconnects, hoses and plate internals add their own drops, and these usually do much of the balancing already. That is a good reason to model them with their real curves instead of treating them as fixed numbers.
6. One fouled plate and a CDU that looks fine
Case E is case A with the plate loss in branch 4 multiplied by four, a crude stand-in for a partly blocked microchannel plate or a half-open quick disconnect. Branch 4 drops to 4.46 L/min, 55.8% of its equal share. The other seven branches pick up the difference, between 8.33 and 8.91 L/min each.

Figure 5. With branch 4 fouled, its flow falls to 4.46 L/min. The total stays at 64 L/min and the manifold pressure drop rises by 139.2 Pa.
At the CDU, the total flow is still 64 L/min. The pressure drop goes from 1425.3 Pa to 1564.5 Pa, an increase of 9.8%, which is easily lost in normal variation between racks. The plate in branch 4 meanwhile has a coolant rise of 16.17 K instead of about 9 K at 5 kW. This is why per-branch flow or return temperature measurement, even temporary during commissioning, is worth more than a tight CDU flow reading.
7. Mesh check and limits
Case A was repeated on a 3.33 mm mesh with 172,800 cells. The spread changed from 7.96% to 8.05%, branch 1 from 8.453 to 8.451 L/min, branch 8 from 7.817 to 7.808 L/min and the manifold pressure drop from 1425.3 to 1429.0 Pa. For the purpose of this comparison the 5 mm mesh is adequate.
The study has clear limits. The ducts are square and the branch entries are sharp, so tee losses will differ from real round tubes with fittings. The cold plates are porous blocks with a single quadratic law, with no internal channel geometry. Hoses and quick disconnects are left out. The fluid is water; a propylene glycol mix has higher viscosity and would shift the friction to momentum balance. The numbers belong to this model. The trends, and the way the header pressures produce them, are what carry over.
8. What to check before commissioning
A flow-split check does not need a full CFD model of every rack. A one-dimensional network with honest loss coefficients for the tees, hoses, quick disconnects and plates will usually tell you whether the manifold is friction or momentum dominated and how large the spread is. CFD earns its place on the headers themselves, where branch entry losses and static regain depend on geometry and flow ratio in a way that tabulated coefficients handle poorly, and wherever the design is close to its thermal margin.
When you review a manifold design, it helps to ask for the predicted flow in every branch as well as the total, at both the design flow and the lowest flow the CDU will run at. Ask whether the plate and quick disconnect curves came from test data. Ask what happens when one branch is partly blocked, and how the site would notice. If the answer to the last question is the CDU flow reading, case E shows why that is not enough.
Where Shirsh fits
At Shirsh Technosolutions we model liquid cooling loops from the CDU to the cold plate, using ANSYS Fluent and OpenFOAM for the headers and manifolds and network models for the full loop, with plate and coupling curves taken from the supplier's test data where they exist. If you are sizing a rack manifold or troubleshooting uneven plate temperatures, please get in touch.
References
ASHRAE Technical Committee 9.9, Thermal Guidelines for Data Processing Environments, 5th edition, 2021 (liquid cooling classes W17 to W+), as summarised by Upsite Technologies, "Major Changes to ASHRAE's Fifth Edition of Thermal Guidelines, Part 3: Liquid Cooling Chapter Updates".
R. A. Bajura and E. H. Jones, "Flow Distribution Manifolds", Journal of Fluids Engineering, 1976.
J. Wang, "Theory of flow distribution in manifolds", Chemical Engineering Journal, 2011.
Worked example: OpenFOAM v1912 runs of cases A to E and the case A mesh check, computed for this article, 30 October 2026.
Click to view full size
Related case studies
Want to Apply This to Your Product?
Our engineers can help you implement these techniques on your specific components and assemblies.
Get insights like this in your inbox
Engineering deep-dives, simulation tips, and industry analysis. No spam, unsubscribe any time.