Electrolyser Halls: What Air Changes Can and Cannot Do for Hydrogen
A room-average check can show a small hydrogen leak diluted to a few percent of the LFL, while a larger hole in the range IEC 60079-10-1 works with fills the same room past the LFL in under four minutes. We set out what the 2020 edition asks for and run the check on a generic electrolyser room.
Read the full article below for the methodology, the data, and the engineering decisions behind it.
Green hydrogen is moving from announcements to signed supply. On 29 October 2026 the government said Indian developers now hold 23 offtake contracts under the National Green Hydrogen Mission, with commitments of over 5.5 lakh tonnes a year, more than 70% of it for export and about ₹90,000 crore of investment behind it. Each of those plants will have electrolyser halls, compressor rooms and purification skids, and each one will need a hazardous area classification before it is energised.
The usual first step in that classification is a ventilation check: take a leak, take the room's air change rate, and see whether the hydrogen is diluted well below its lower flammable limit (LFL). This note looks at what IEC 60079-10-1 actually asks for, runs that check for a generic room, and shows where a comfortable room-average number stops meaning much.
1. What IEC 60079-10-1 (2020) asks for
IEC 60079-10-1 is the standard used in India and most other places to classify areas where gas can form an explosive atmosphere. The third edition, published in 2020, keeps the same chain of reasoning as before. Annex B (clause B.7) estimates the release rate from each source. Clause 7.2.4 and Annex C (clause C.3.5) assess the degree of dilution, using the chart in Figure C.1. Figure D.1 then gives an estimate of the hazardous distance, and Table D.1 turns the grade of release and the ventilation into a zone type. The edition also has an informative Annex H on hydrogen.
Two changes in the 2020 text are worth knowing. The safety factor k was removed from the horizontal axis of Figure C.1, because the committee found it unnecessary and confusing given how the chart was derived. Limitations were also placed on the use of the Figure D.1 chart. Both changes push the user away from treating the charts as a formula that settles everything.
The standard works with small holes. As Connor and co-authors (Hazards 32, 2022) put it, it considers releases in the order of 0.025 to 2.5 mm², which is a hole diameter of about 0.2 to 1.8 mm. We use those two ends and the middle value below.
Step | Where in IEC 60079-10-1 (2020) | What it gives you |
|---|---|---|
Release rate | Annex B, clause B.7 | Mass flow from each source, for a hole size chosen per the source |
Degree of dilution | Clause 7.2.4, Annex C clause C.3.5, Figure C.1 | High, medium or low dilution, from the release characteristic and the ventilation velocity |
Change in 2020 | Figure C.1 axis | Safety factor k removed from the release characteristic |
Hazardous distance | Figure D.1 (with limits on its use) | An estimate of zone extent from the release characteristic |
Zone type | Table D.1 | Zone 0, 1, 2 or negligible extent, from grade of release and ventilation |
Hydrogen | Annex H (informative) | Guidance specific to hydrogen |
2. A quick check: three leaks in one room
We took a generic room of 8 m by 6 m by 4 m, which is 192 m³, with a hydrogen line at 30 bar absolute and 20 °C. For each hole we worked out the choked (sonic) mass flow with the ideal gas orifice equation and a discharge coefficient of 0.75, then the volume flow of hydrogen at room conditions. We then assumed the room is perfectly mixed and found the steady average concentration for a given number of air changes per hour.
The smallest hole, 0.025 mm², leaks 0.035 g/s, about 25 litres of hydrogen a minute. At 6 air changes per hour the room average settles at 3.3% of LFL. The middle hole, 0.25 mm², leaks 0.35 g/s, about 251 litres a minute, and the average settles at 32.3% of LFL at 6 air changes and 16.3% at 12. To hold that average at 25% of LFL, which is 1% hydrogen by volume, the room needs 7.8 air changes per hour.
The largest hole, 2.5 mm², leaks 3.5 g/s. At 6 air changes the room average would settle at 289% of LFL, and at 12 air changes at 154%. Holding the average at 25% of LFL needs 78 air changes per hour, which is far beyond what a normal plant room is designed for.

Figure 1. Computed for this note. Steady room-average hydrogen for three hole sizes at 30 bar absolute in a well-mixed 192 m³ room. Holding the average at 25% of LFL needs 7.8 air changes per hour for the 0.25 mm² hole and 78 for the 2.5 mm² hole.
The build-up is quick too. At 6 air changes per hour the 0.25 mm² leak takes the average past 25% of LFL in about 14.7 minutes. The 2.5 mm² leak does it in 0.8 minutes and passes the LFL itself at 3.7 minutes, so any detection and shut-off has to act within a minute or two to matter.

Figure 2. Computed for this note. Room-average build-up at 6 air changes per hour after the leak starts, well-mixed assumption.
3. Why the average is the optimistic number
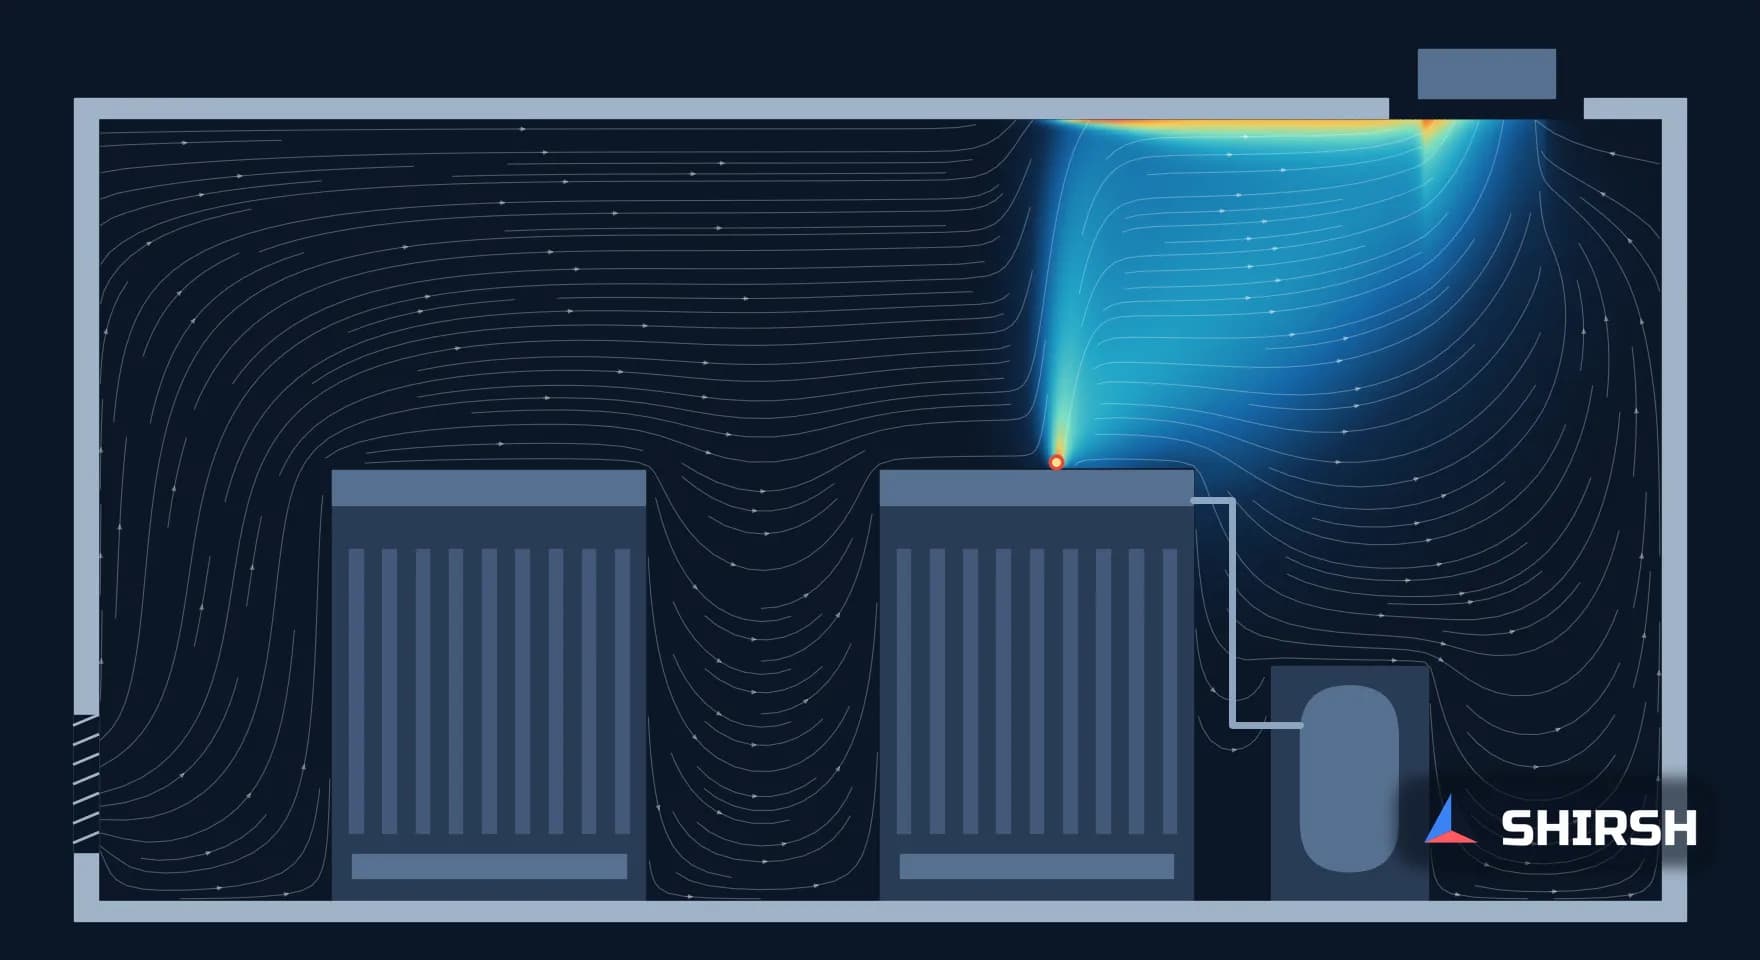
Everything above assumes the hydrogen spreads evenly through all 192 m³ the moment it leaves the hole. Hydrogen does not behave like that. At 20 °C its density is 0.084 kg/m³ against 1.20 kg/m³ for air, about 7% of it, so a leak rises fast and collects under the roof unless high-level extract takes it away. Near the release the jet itself is far richer than any room average. Our earlier OpenFOAM study of a ventilated BESS container showed the same thing for battery off-gas: hydrogen layering under the roof while the dilution ratio said the container was fine.
The IEC route reflects this through the release characteristic, the release rate divided by gas density and LFL. For our three holes it is 0.0105, 0.105 and 1.05 m³/s. Connor and co-authors worked through a hydrogen compressor enclosure at 950 barg and 30 °C. A 0.1 mm² hole gave a release characteristic of 1.35 m³/s, close to our 2.5 mm² case, and they had to extend the Figure C.1 line to find that a ventilation velocity of 18 m/s would be needed for high dilution. For 0.5 mm² it was 85 m/s. Their conclusion was that a zone of negligible extent was not achievable, and that a 3 m Zone 2 would cover the whole enclosure.
So the room-average check and the chart answer different questions. The average tells you whether the room as a whole can fill up. The chart, and the hazardous distance after it, tell you how far a flammable cloud can reach from the leak, and that depends on where the air actually moves, not on how much of it the fans deliver.
4. What we would want to see in an electrolyser hall study
For a new hall, the evidence we would want before the zone drawing is signed is fairly short. The release sources and hole sizes should be listed with the pressure at each one, since the release rate scales directly with pressure. The ventilation check should be done with the release characteristic and Figure C.1, not only with an air change rate, and the use of Figure D.1 should respect the limits the 2020 edition sets on it. Extract should be at high level, where the hydrogen goes, and gas detectors should sit in the places the flow actually carries it, not only above each skid.
Where the room is congested or the fans are close to the sources, a CFD study of the actual layout can show the flammable cloud volume, where it sits under the roof and how long it takes to clear after an isolation. That makes the zone extent and the detector positions a result rather than a guess.
Where Shirsh fits
At Shirsh Technosolutions we carry out CFD studies of gas dispersion and ventilation with ANSYS Fluent and OpenFOAM, including hydrogen release, flammable cloud volume and detector placement in enclosed process rooms. If you are designing or classifying an electrolyser hall, compressor shelter or hydrogen skid enclosure, please get in touch.
References
IEC 60079-10-1:2020 (Edition 3.0), Explosive atmospheres, Part 10-1: Classification of areas, Explosive gas atmospheres. Clause structure, annex titles and the list of technical changes (removal of factor k from Figure C.1, limits on Figure D.1) as given in the publisher's preview of the standard.
J. Connor, P. Giacopinelli, K. Almeida Leñero, "Is ventilation your trustworthy old friend when it comes to hydrogen?", Hazards 32, IChemE Symposium Series No. 169, 2022.
News On AIR, "Indian developers secure 23 major contracts under National Green Hydrogen Mission", 29 October 2026.
Hydrogen LFL of 4% by volume as used by A.J. Ruggles and I.W. Ekoto, "Ignitability and mixing of underexpanded hydrogen jets", International Conference on Hydrogen Safety.
Release rates, room averages, build-up times and densities: fe/calc_h2.py and fe/figs.py, run 2 November 2026. Generic room; not any project.
Click to view full size
Related case studies

Want to Apply This to Your Product?
Our engineers can help you implement these techniques on your specific components and assemblies.
Get insights like this in your inbox
Engineering deep-dives, simulation tips, and industry analysis. No spam, unsubscribe any time.