Cyclone Separator CFD for FCC Regenerator Cyclones: Efficiency, Pressure Drop and Erosion
Cyclone separator CFD in ANSYS Fluent for FCC regenerator primary and secondary cyclones: swirl flow, grade efficiency, pressure drop and wear zones.
Project brief
A cyclone and gas cleaning equipment supplier asked Shirsh Technosolutions to look inside the primary and secondary cyclones of a fluid catalytic cracking (FCC) regenerator. The cyclones were an existing set. The supplier wanted to see how the gas swirls through them, how well each stage catches catalyst fines of different sizes, how much pressure each stage costs and where the refractory lining is likely to wear.
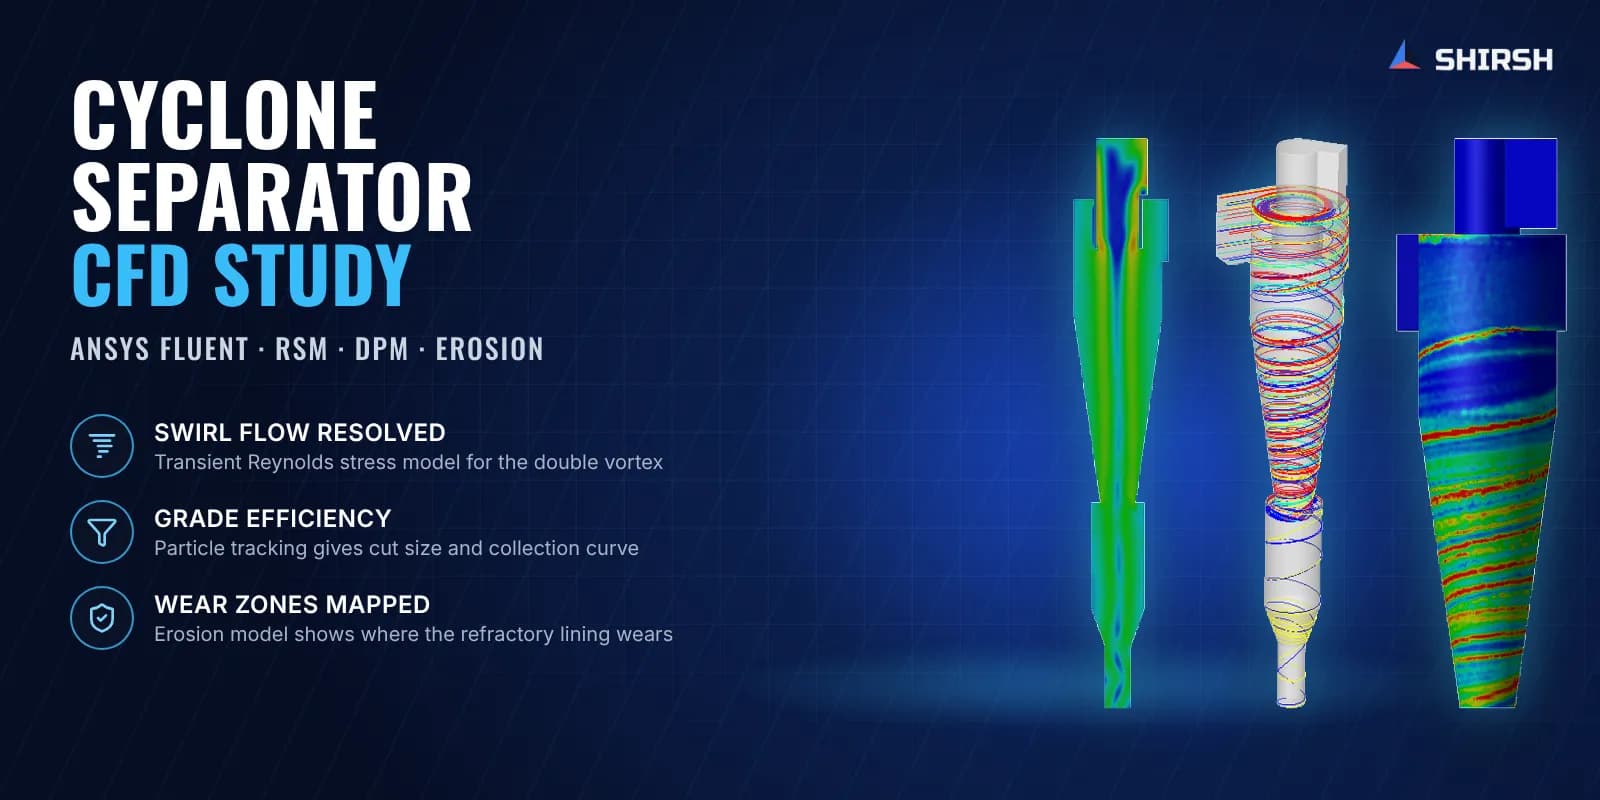
We ran a cyclone separator CFD study in ANSYS Fluent for both stages. The swirling gas flow was solved with a transient Reynolds stress turbulence model, and catalyst particles were tracked through it with the discrete phase model. From that we produced a grade (fractional) efficiency curve and cut size for each cyclone, the pressure drop across each stage, velocity profiles across the barrel and erosion maps of the walls. The supplier received all of it in one report it could use with its own refinery client.
What was at risk
A regenerator cyclone set has to hold back the catalyst while hot flue gas leaves the vessel. Fines that slip through are lost catalyst, and fines that keep scouring one part of the wall wear out the lining. Both problems are costly, and both start inside the cyclone where nobody can look during operation.
The usual empirical cyclone models were built from small sampling cyclones. They assume a steady, symmetric flow and miss the unsteady, off-centre vortex, flow reversal and short-circuit flow that a full-size industrial cyclone actually has. So the supplier's own correlations and software gave one picture of efficiency, and it needed an independent look based on the real geometry.
There were two practical constraints too. The secondary cyclone sees the gas that comes out of the primary, so the two stages had to be linked. And the supplier needed answers quickly, while its client was waiting for a reply.
Solution offered
Real geometry, refractory wall. The primary and secondary cyclones were modelled from the supplier's drawings and dimension table, and the gas volume was extracted for CFD. The internal wall is the bonded refractory lining, so a surface roughness agreed with the supplier was applied to it. Gravity was included because it matters for how catalyst settles into the dipleg.
Mesh built for swirl. Both cyclones were meshed with polyhedral cells inside the allowed skewness and orthogonal quality, with inflation layers at the wall to capture the near-wall flow that carries particles down to the collector.
A turbulence model that can see the double vortex. Two-equation models tend to predict only a single forced vortex in a cyclone. We used the unsteady Reynolds stress model (RSM) with scalable wall functions, which published validation work shows to track measured tangential velocity profiles far better. This is the practical choice for full-size industrial cyclones where LES would be too costly.
Primary and secondary in sequence. The primary cyclone was solved first from the design inlet conditions. Its outlet conditions then became the inlet of the secondary cyclone, so the two stages were linked without one very large combined model.
Particle tracking and grade efficiency. Catalyst particles of the given density were injected over a range of sizes with one-way coupling, which is reasonable at the low solids loading of a cyclone. Each particle either reached the collector, escaped through the vortex finder or stayed in the swirl. Efficiency for each size was taken as trapped particles over the particles that finished their path, which gave a fractional efficiency curve and cut size for each stage.
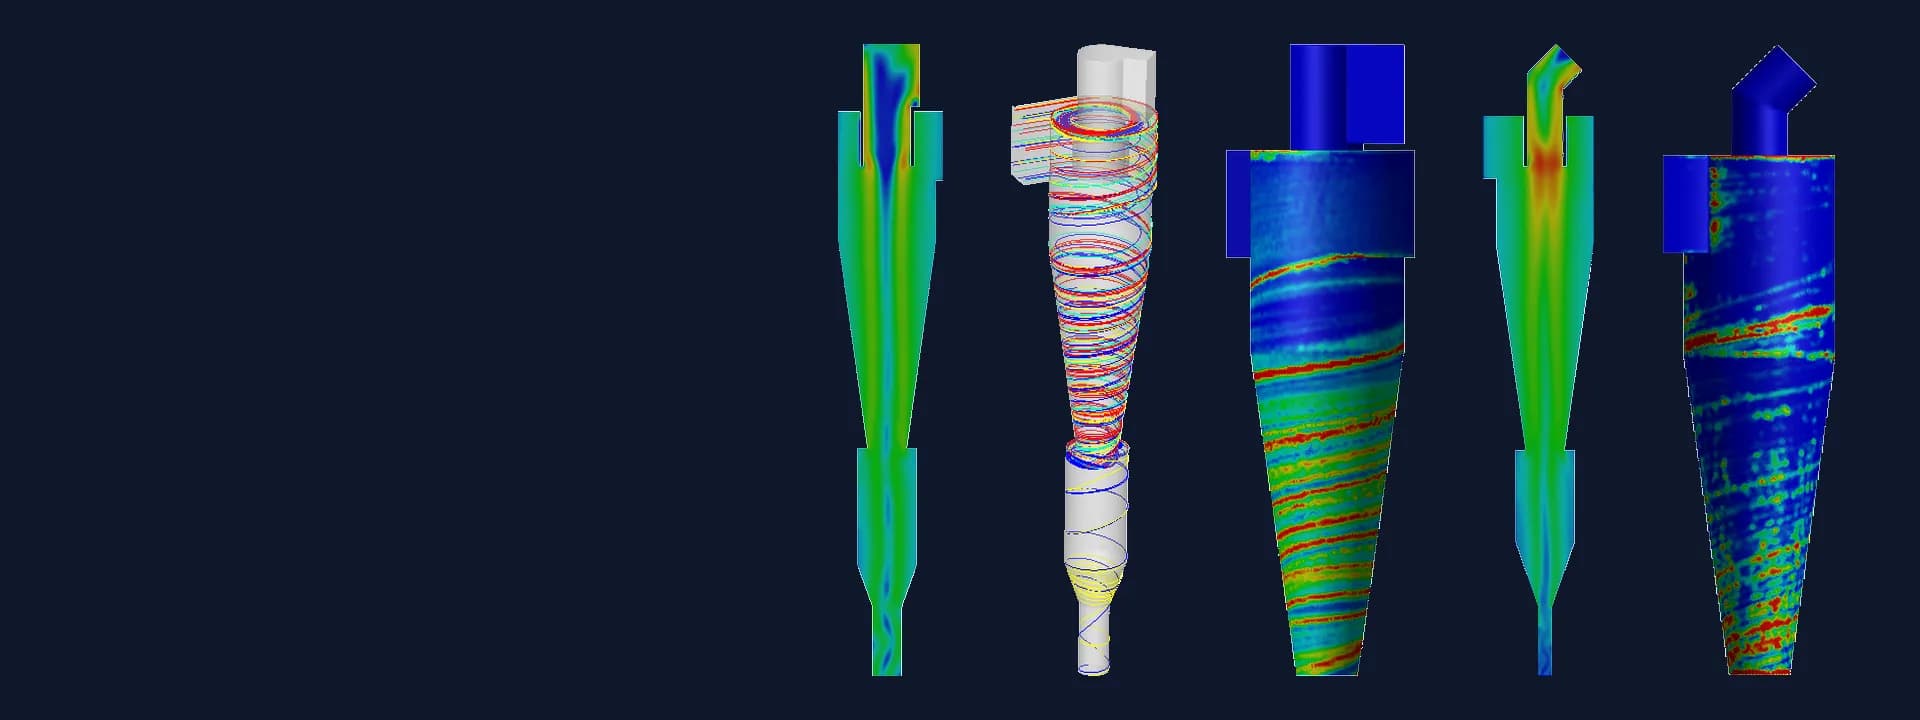
Pressure drop and flow profiles. Total pressure drop was reported for each cyclone. Axial, radial and tangential velocity were plotted across the barrel to show the vortex structure, the reversal of axial flow and the position of the vortex core.
Erosion map. A generic erosion model in Fluent was run on the particle tracks to show where repeated particle impacts concentrate on the wall. This marks the zones to watch during inspection and relining.
Common questions
Why use CFD instead of empirical models for a cyclone separator? Empirical cyclone models come from small test cyclones and assume a steady, symmetric flow. A full-size cyclone has an unsteady, off-centre vortex, flow reversal and short-circuit flow, and CFD with a Reynolds stress turbulence model captures these directly on the actual geometry.
How is cyclone grade efficiency found from CFD? Particles of each size are injected at the inlet and tracked through the solved gas flow with the discrete phase model. The share of particles that reach the dust or catalyst collector, out of those that complete their path, gives the efficiency for that size. Plotting it against size gives the grade efficiency curve and the cut size.
Challenges we overcame
Strong, unsteady swirl that simple turbulence models get wrong
Primary and secondary stages that depend on each other
Grade efficiency needed across a wide range of catalyst particle sizes
Particles that stay trapped in the swirl and never finish their path
Rough refractory lining on the cyclone walls
Wear zones that cannot be seen while the unit is running
How we executed
- 1
Reviewed the cyclone drawings, dimension ratios, design conditions and regenerator layout from the supplier
- 2
Built 3D models of the primary and secondary cyclones and extracted the gas volume
- 3
Meshed both cyclones with polyhedral cells and wall inflation layers
- 4
Solved the primary cyclone with the unsteady Reynolds stress model and gravity
- 5
Used the primary outlet conditions as the inlet for the secondary cyclone
- 6
Tracked catalyst particles of several sizes with the discrete phase model
- 7
Worked out grade efficiency, cut size and pressure drop for each stage
- 8
Ran the erosion model and issued the report with velocity, pressure, efficiency and wear results
Project outcome
Grade efficiency curves and cut sizes for both the primary and the secondary cyclone, with full capture of the coarser fines in both stages.
The secondary cyclone showed a finer cut size than the primary.
Pressure drop for each stage, from the same models.
The vortex structure differed between the stages: a W-shaped axial velocity profile in the primary and a V-shaped one in the secondary.
Likely wear zones mapped near the inlet, at the cylinder to cone junction and along the cone.
A cyclone set studied on its real geometry, giving the supplier a base for its talks with the refinery client.
Project gallery
Where this lives
Software used
Related solutions
Industries
At a glance
We apply the same rigour to every engagement
Let us show you what's possible for your product.